

Question: What would the graphs look like for this? Linear, quadratic and cubic. What would be the best graph to be the best trendline? Q L
What would the graphs look like for this? Linear, quadratic and cubic. What would be the best graph to be the best trendline?
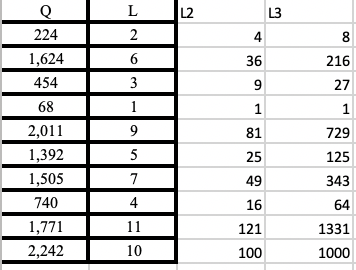
Q L L2 L3 224 2 4 8 1,624 36 216 454 9 27 68 1 2,011 81 729 1,392 25 125 1,505 49 343 740 4 16 64 1,771 11 121 1331 2.242 10 100 1000
Step by Step Solution
There are 3 Steps involved in it
1 Expert Approved Answer
Step: 1 Unlock

Question Has Been Solved by an Expert!
Get step-by-step solutions from verified subject matter experts
Step: 2 Unlock
Step: 3 Unlock