

Question: What would the most practical forecasting technique be to predict 2021 info given the data below? I need to use excel- please be specific and
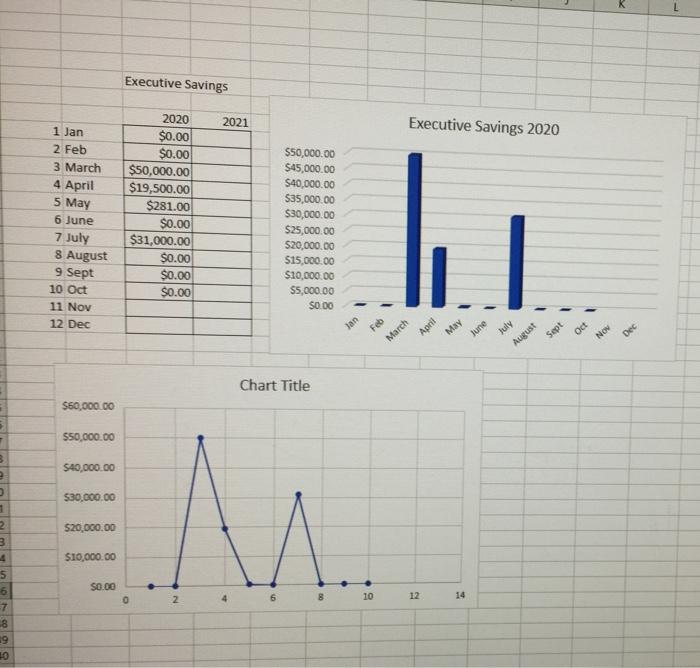
Executive Savings 2021 Executive Savings 2020 1 Jan 2 Feb 3 March 4 April 5 May 6 June 7 July 8 August 9 Sept 10 Oct 11 Nov 12 Dec 2020 $0.00 $0.00 $50,000.00 $19,500.00 $281.00 $0.00 $31,000.00 $0.00 $0.00 $0.00 550,000.00 $45,000.00 $40,000.00 $35,000.00 $30,000.00 $25,000.00 $20,000.00 $15,000.00 $10,000.00 $5,000.00 $0.00 Jan April July Sept August Oer May Feb March he May June Chart Title $60,000.00 $50,000.00 B $40,000.00 $30,000.00 1 2 3 M $20,000.00 $10,000.00 $0.00 0 2 6 12 10 8 14 5 6 -7 8 19 30 Executive Savings 2021 Executive Savings 2020 1 Jan 2 Feb 3 March 4 April 5 May 6 June 7 July 8 August 9 Sept 10 Oct 11 Nov 12 Dec 2020 $0.00 $0.00 $50,000.00 $19,500.00 $281.00 $0.00 $31,000.00 $0.00 $0.00 $0.00 550,000.00 $45,000.00 $40,000.00 $35,000.00 $30,000.00 $25,000.00 $20,000.00 $15,000.00 $10,000.00 $5,000.00 $0.00 Jan April July Sept August Oer May Feb March he May June Chart Title $60,000.00 $50,000.00 B $40,000.00 $30,000.00 1 2 3 M $20,000.00 $10,000.00 $0.00 0 2 6 12 10 8 14 5 6 -7 8 19 30
Step by Step Solution
There are 3 Steps involved in it

Get step-by-step solutions from verified subject matter experts