

Question: What would the scatter plot show for data that produce a Pearson correlation of r = +0.95?points clustered close to a line that slopes up
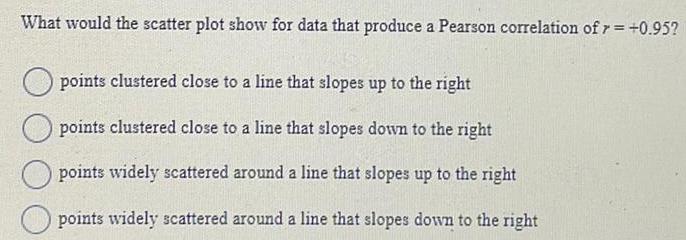

What would the scatter plot show for data that produce a Pearson correlation of r = +0.95?points clustered close to a line that slopes up to the rightpoints clustered close to a line that slopes down to the rightpoints widely scattered around a line that slopes up to the rightpoints widely scattered around a line that slopes down to the right
Step by Step Solution
There are 3 Steps involved in it
1 Expert Approved Answer
Step: 1 Unlock

Question Has Been Solved by an Expert!
Get step-by-step solutions from verified subject matter experts
Step: 2 Unlock
Step: 3 Unlock