

Question: whats code i can use it to solve this question on r Two makers of topped pies that wouldn't be called pizza in Italy nor
 whats code i can use it to solve this question on r
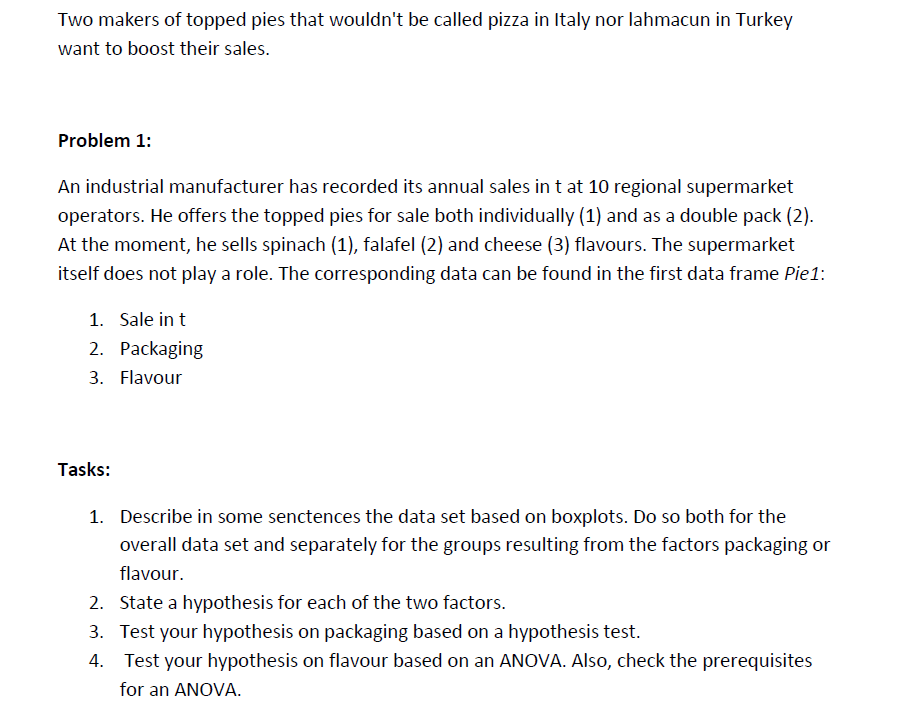
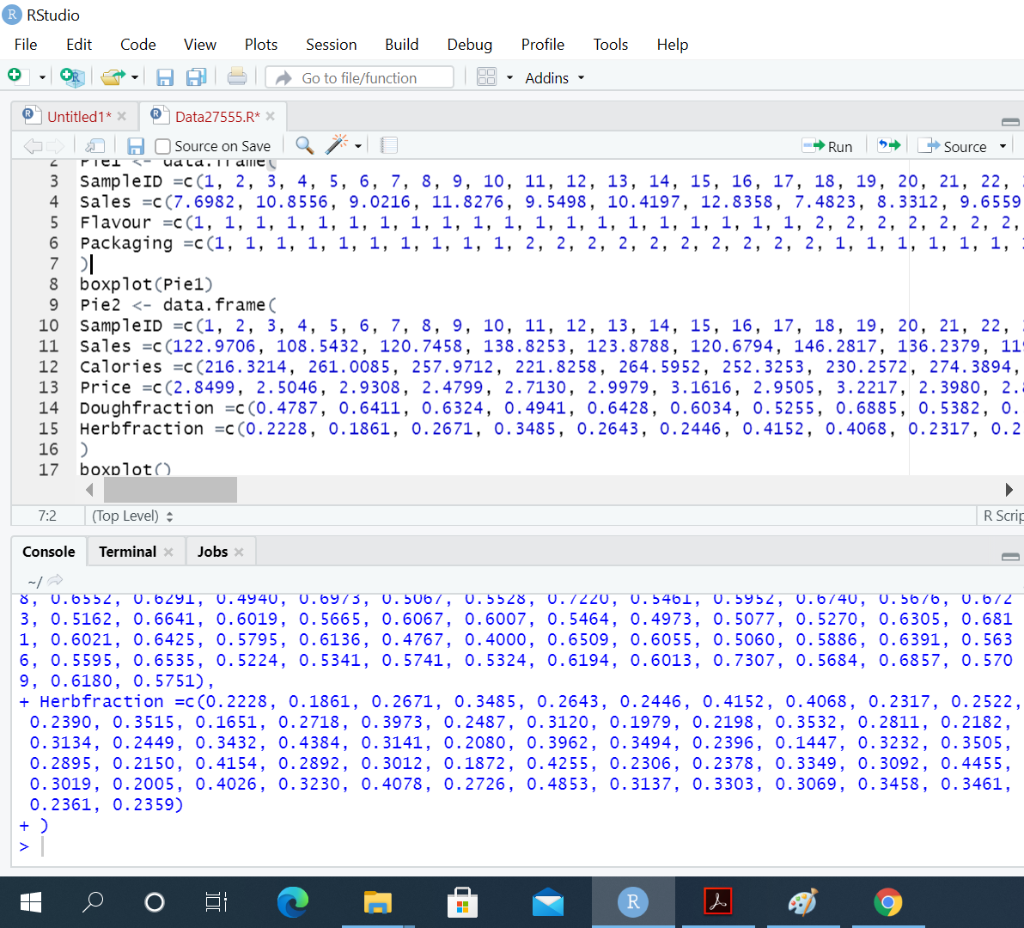
Two makers of topped pies that wouldn't be called pizza in Italy nor lahmacun in Turkey want to boost their sales. Problem 1: An industrial manufacturer has recorded its annual sales in t at 10 regional supermarket operators. He offers the topped pies for sale both individually (1) and as a double pack (2). At the moment, he sells spinach (1), falafel (2) and cheese (3) flavours. The supermarket itself does not play a role. The corresponding data can be found in the first data frame Pie1: 1. Sale in t 2. Packaging 3. Flavour Tasks: 1. Describe in some senctences the data set based on boxplots. Do so both for the overall data set and separately for the groups resulting from the factors packaging or flavour. 2. State a hypothesis for each of the two factors. 3. Test your hypothesis on packaging based on a hypothesis test. 4. Test your hypothesis on flavour based on an ANOVA. Also, check the prerequisites for an ANOVA. RStudio File Edit Code View Plots Session Build Debug Profile Tools Help + Go to file/function - Addins - 2 Untitled1* x @ Data27555.R* X A Source on Save Run Source TELUcld. Il dille 3 Sample ID =C(1, 2, 3, 4, 5, 6, 7, 8, 9, 10, 11, 12, 13, 14, 15, 16, 17, 18, 19, 20, 21, 22, 4 Sales =C(7.6982, 10.8556, 9.0216, 11.8276, 9.5498, 10.4197, 12.8358, 7.4823, 8.3312, 9.6559 5 Flavour =C(1, 1, 1, 1, 1, 1, 1, 1, 1, 1, 1, 1, 1, 1, 1, 1, 1, 1, 1, 1, 2, 2, 2, 2, 2, 2, 2, 6 Packaging =C(1, 1, 1, 1, 1, 1, 1, 1, 1, 1, 2, 2, 2, 2, 2, 2, 2, 2, 2, 2, 1, 1, 1, 1, 1, 1, 7 8 boxplot(Piel) 9 Pie2 17 boxploto 7:2 (Top Level) R Scrig Console Terminal Jobs 8, 0.6552, 0.6291, 0.4940, 0.6973, 0.5067, 0.5528, 0.7220, 0.5461, 0.5952, 0.6740, 0.5676, 0.672 3, 0.5162, 0.6641, 0.6019, 0.5665, 0.6067, 0.6007, 0.5464, 0.4973, 0.5077, 0.5270, 0.6305, 0.681 1, 0.6021, 0.6425, 0.5795, 0.6136, 0.4767, 0.4000, 0.6509, 0.6055, 0.5060, 0.5886, 0.6391, 0.563 6, 0.5595, 0.6535, 0.5224, 0.5341, 0.5741, 0.5324, 0.6194, 0.6013, 0.7307, 0.5684, 0.6857, 0.570 9, 0.6180, 0.5751), + Herbfraction =c(0.2228, 0.1861, 0.2671, 0.3485, 0.2643, 0.2446, 0.4152, 0.4068, 0.2317, 0.2522, 0.2390, 0.3515, 0.1651, 0.2718, 0.3973, 0.2487, 0.3120, 0.1979, 0.2198, 0.3532, 0.2811, 0.2182, 0.3134, 0.2449, 0.3432, 0.4384, 0.3141, 0.2080, 0.3962, 0.3494, 0.2396, 0.1447, 0.3232, 0.3505, 0.2895, 0.2150, 0.4154, 0.2892, 0.3012, 0.1872, 0.4255, 0.2306, 0.2378, 0.3349, 0.3092, 0.4455, 0.3019, 0.2005, 0.4026, 0.3230, 0.4078, 0.2726, 0.4853, 0.3137, 0.3303, 0.3069, 0.3458, 0.3461, 0.2361, 0.2359) +) H a R Two makers of topped pies that wouldn't be called pizza in Italy nor lahmacun in Turkey want to boost their sales. Problem 1: An industrial manufacturer has recorded its annual sales in t at 10 regional supermarket operators. He offers the topped pies for sale both individually (1) and as a double pack (2). At the moment, he sells spinach (1), falafel (2) and cheese (3) flavours. The supermarket itself does not play a role. The corresponding data can be found in the first data frame Pie1: 1. Sale in t 2. Packaging 3. Flavour Tasks: 1. Describe in some senctences the data set based on boxplots. Do so both for the overall data set and separately for the groups resulting from the factors packaging or flavour. 2. State a hypothesis for each of the two factors. 3. Test your hypothesis on packaging based on a hypothesis test. 4. Test your hypothesis on flavour based on an ANOVA. Also, check the prerequisites for an ANOVA. RStudio File Edit Code View Plots Session Build Debug Profile Tools Help + Go to file/function - Addins - 2 Untitled1* x @ Data27555.R* X A Source on Save Run Source TELUcld. Il dille 3 Sample ID =C(1, 2, 3, 4, 5, 6, 7, 8, 9, 10, 11, 12, 13, 14, 15, 16, 17, 18, 19, 20, 21, 22, 4 Sales =C(7.6982, 10.8556, 9.0216, 11.8276, 9.5498, 10.4197, 12.8358, 7.4823, 8.3312, 9.6559 5 Flavour =C(1, 1, 1, 1, 1, 1, 1, 1, 1, 1, 1, 1, 1, 1, 1, 1, 1, 1, 1, 1, 2, 2, 2, 2, 2, 2, 2, 6 Packaging =C(1, 1, 1, 1, 1, 1, 1, 1, 1, 1, 2, 2, 2, 2, 2, 2, 2, 2, 2, 2, 1, 1, 1, 1, 1, 1, 7 8 boxplot(Piel) 9 Pie2 17 boxploto 7:2 (Top Level) R Scrig Console Terminal Jobs 8, 0.6552, 0.6291, 0.4940, 0.6973, 0.5067, 0.5528, 0.7220, 0.5461, 0.5952, 0.6740, 0.5676, 0.672 3, 0.5162, 0.6641, 0.6019, 0.5665, 0.6067, 0.6007, 0.5464, 0.4973, 0.5077, 0.5270, 0.6305, 0.681 1, 0.6021, 0.6425, 0.5795, 0.6136, 0.4767, 0.4000, 0.6509, 0.6055, 0.5060, 0.5886, 0.6391, 0.563 6, 0.5595, 0.6535, 0.5224, 0.5341, 0.5741, 0.5324, 0.6194, 0.6013, 0.7307, 0.5684, 0.6857, 0.570 9, 0.6180, 0.5751), + Herbfraction =c(0.2228, 0.1861, 0.2671, 0.3485, 0.2643, 0.2446, 0.4152, 0.4068, 0.2317, 0.2522, 0.2390, 0.3515, 0.1651, 0.2718, 0.3973, 0.2487, 0.3120, 0.1979, 0.2198, 0.3532, 0.2811, 0.2182, 0.3134, 0.2449, 0.3432, 0.4384, 0.3141, 0.2080, 0.3962, 0.3494, 0.2396, 0.1447, 0.3232, 0.3505, 0.2895, 0.2150, 0.4154, 0.2892, 0.3012, 0.1872, 0.4255, 0.2306, 0.2378, 0.3349, 0.3092, 0.4455, 0.3019, 0.2005, 0.4026, 0.3230, 0.4078, 0.2726, 0.4853, 0.3137, 0.3303, 0.3069, 0.3458, 0.3461, 0.2361, 0.2359) +) H a R
Step by Step Solution
There are 3 Steps involved in it

Get step-by-step solutions from verified subject matter experts