

Question: Whats the answer and why The histogram below shows the length (in minutes) of 140 songs recorded by the band Wilco. 60 50 Frequency 2
Whats the answer and why
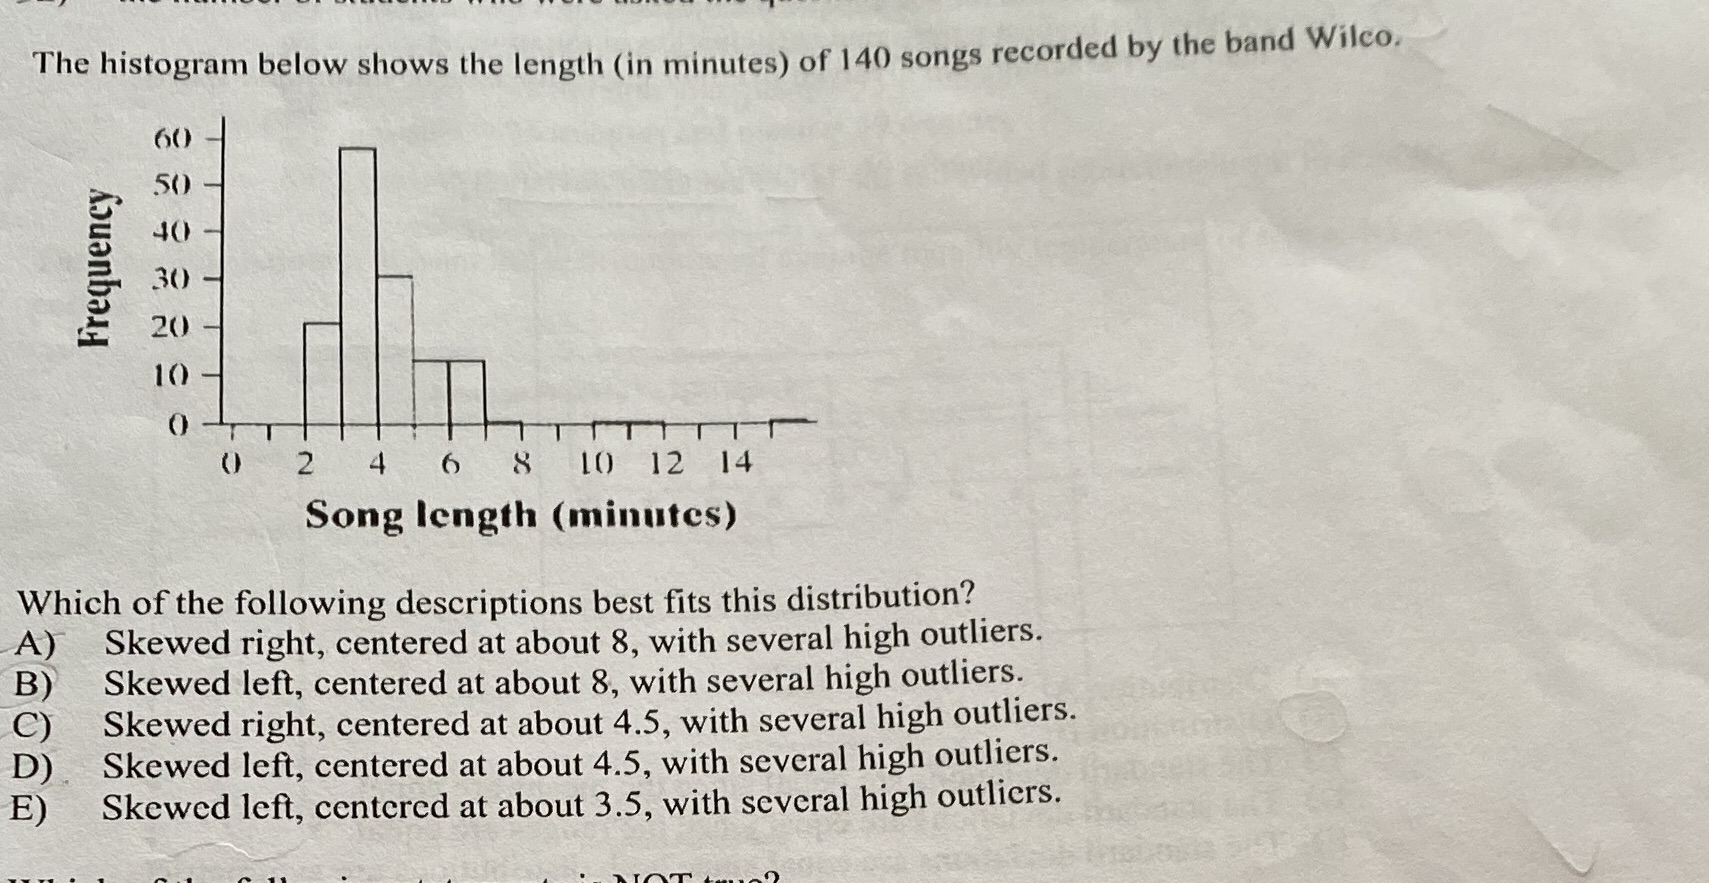
The histogram below shows the length (in minutes) of 140 songs recorded by the band Wilco. 60 50 Frequency 2 4 6 8 10 12 14 Song length (minutes) Which of the following descriptions best fits this distribution? A) Skewed right, centered at about 8, with several high outliers. B) Skewed left, centered at about 8, with several high outliers. C) Skewed right, centered at about 4.5, with several high outliers. D) Skewed left, centered at about 4.5, with several high outliers. Skewed left, centered at about 3.5, with several high outliers
Step by Step Solution
There are 3 Steps involved in it
1 Expert Approved Answer
Step: 1 Unlock

Question Has Been Solved by an Expert!
Get step-by-step solutions from verified subject matter experts
Step: 2 Unlock
Step: 3 Unlock