

Question: What's the answer for question B Data were collected that included information on the weight of the trash (in pounds) on '6' the street one
What's the answer for question B
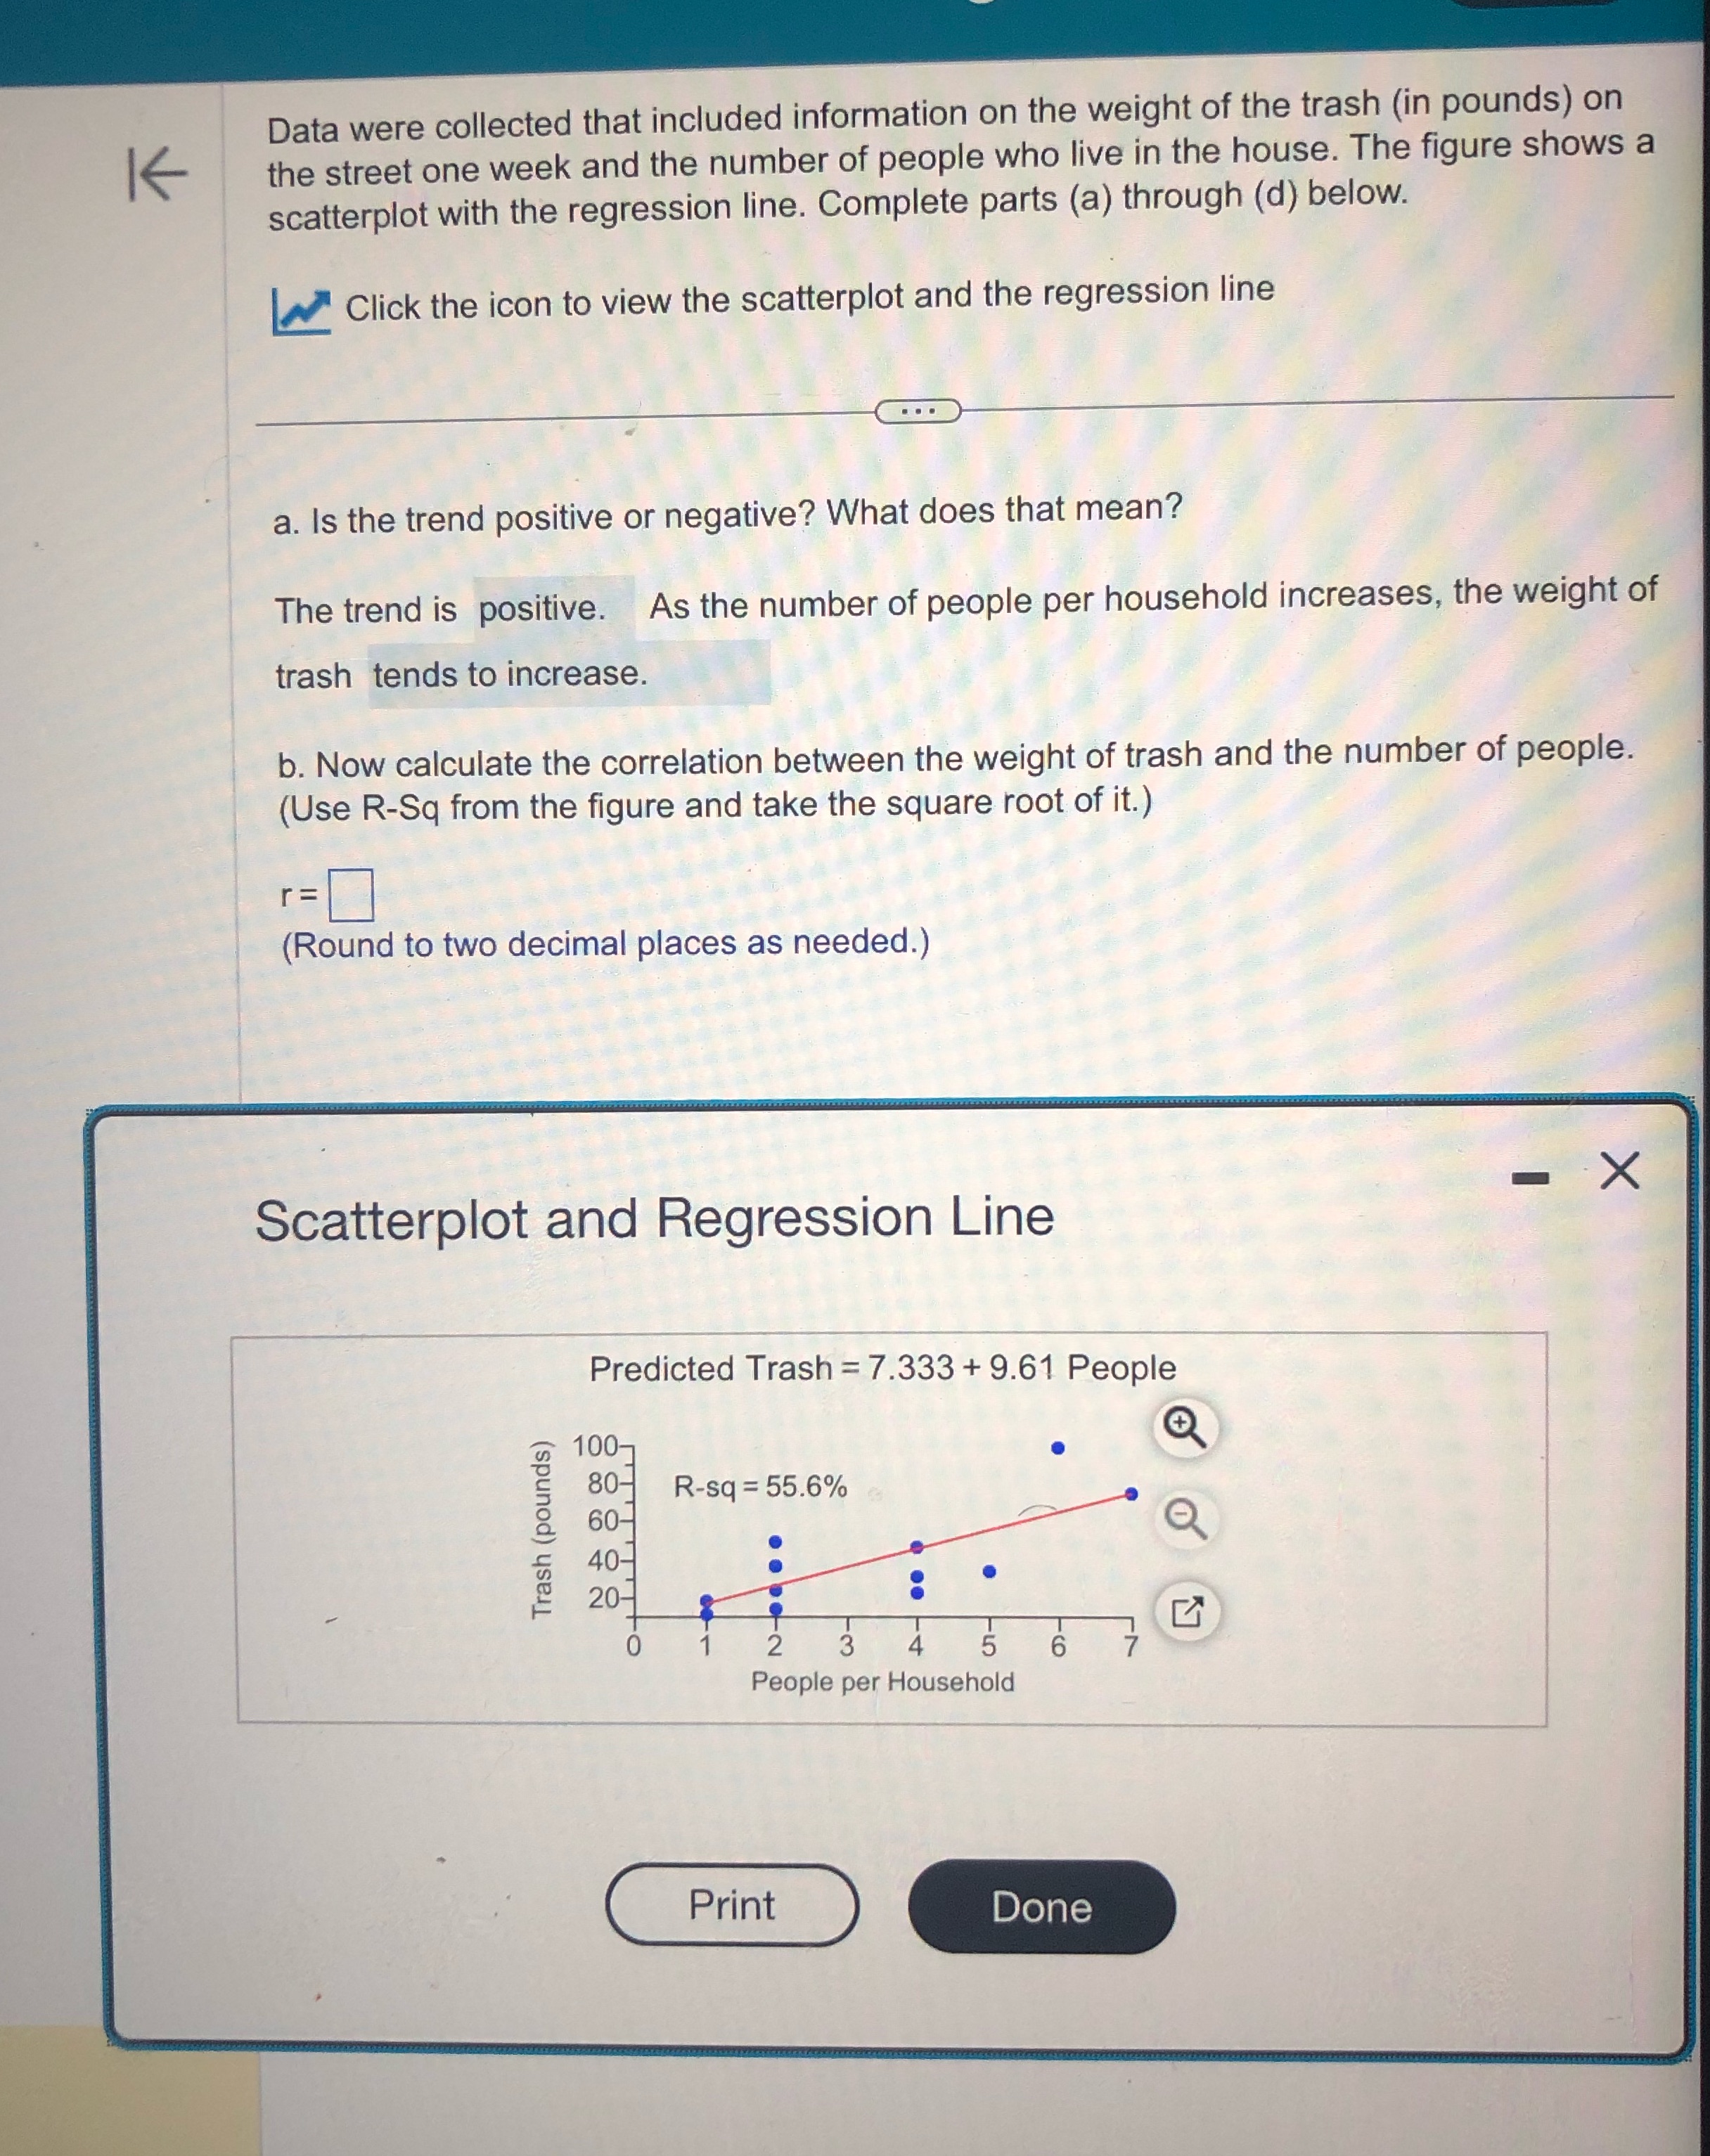
Data were collected that included information on the weight of the trash (in pounds) on '6' the street one week and the number of people who live in the house. The gure shows a scatterplot with the regression line. Complete parts (a) through (d) below. L1: Click the icon to View the scatterplot and the regression line W ' a. is the trend positive or negative? What does that mean? The trend is positive. As the number of people per household increases, the weight of trash tends to increase. b. Now calculate the correlation between the weight of trash and the number of people. (Use R-Sq from the gure and take the square root of it.) r=D (Round to two decimal places as needed.) Soatterplot and Regression Line Predicted Trash = 7.333 + 9.61 People Rsq = 55.6% 100 0 Q ' Q Trash (pounds) 03 o 0 1 2 3 4 5 6 7 i People per Household
Step by Step Solution
There are 3 Steps involved in it

Get step-by-step solutions from verified subject matter experts