

Question: What's the answer for this? We will use the data on cat people again. Here are ages of 18 cat people: 17, 25, 22, 34,
What's the answer for this?
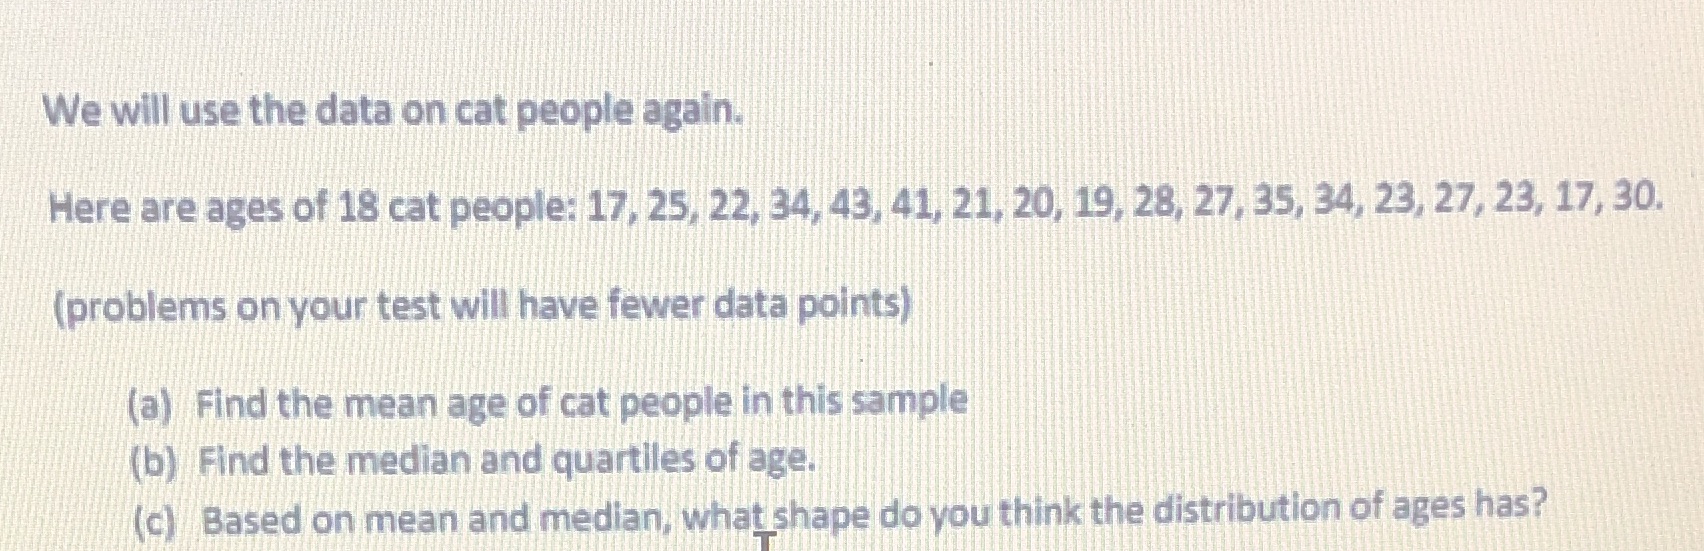
We will use the data on cat people again. Here are ages of 18 cat people: 17, 25, 22, 34, 43, 41, 21, 20, 19, 28, 27, 35, 34, 23, 27, 23, 17, 30. (problems on your test will have fewer data points) (a) Find the mean age of cat people in this sample (b) Find the median and quartiles of age. (c) Based on mean and median, what shape do you think the distribution of ages has
Step by Step Solution
There are 3 Steps involved in it
1 Expert Approved Answer
Step: 1 Unlock

Question Has Been Solved by an Expert!
Get step-by-step solutions from verified subject matter experts
Step: 2 Unlock
Step: 3 Unlock