

Question: whats the steps of the solution in excel Chapter? Linear Region Top 5 Winnings 3.254,00 Pales Points Driver Wins . Top 10 6 7 5
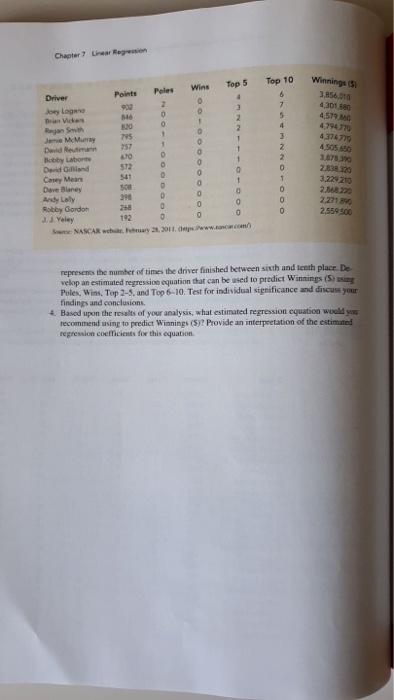
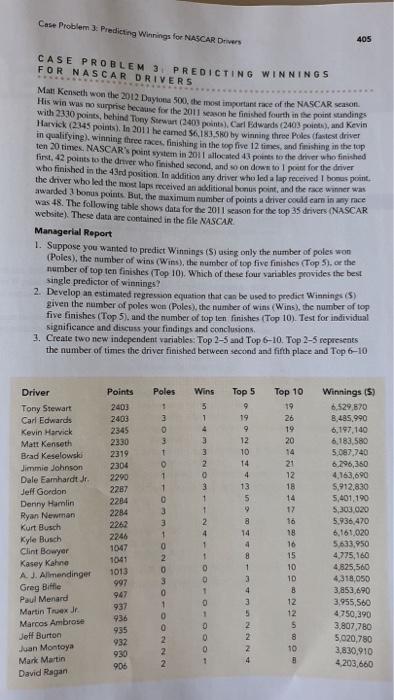
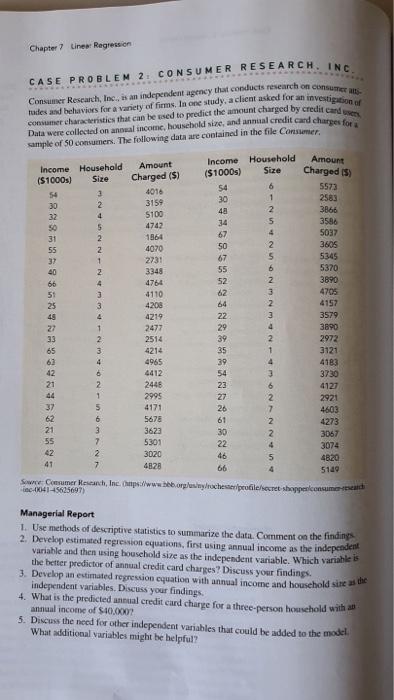
Chapter? Linear Region Top 5 Winnings 3.254,00 Pales Points Driver Wins . Top 10 6 7 5 795 . + 1 0 1 0 0 3 2 2 1 1 1 Dedema 4.51 4794 4,3747 4505.56 1. 2.3 3.229210 0 2 2 0 1 0 0 0 Carey Men 541 Dave Blaney 0 0 Andy Laly 390 D Robby Gordon 0 Yley 0 192 0 0 NASCAR way. 3011. www.cancer.com 2.559 50 represents the number of times the driver finished between sixth and enth plaer De velop an estimated regression equation that can be used to predict Winnings (5) Potes, Wins, Top 2-5 and Top 6-10. Test for individual significance and discuss your findings and conclusions. 4. Based upon the results of your analysis, what estimated regression equation woody recommend using to predict Winnings (5)? Provide an interpretation of the estimated regression coefficients for this equation Case Problem ). Predicting Winnings for NASCAR DE 405 CASE PROBLEM 3. PREDICTING WINNINOS FOR NASCAR DRIVERS Matt Kenseth won the 2012 Daytona 500, the most important race of the NASCAR His win was no surprise became for the 2011 sease be finished forth in the pointstandings with 2330 points, behind Tony Stewart (2403 pente), Carl Edwards (2002) peit), and Kevin Harvick (2345 points). In 2011 he came 56.183.580 by winning three Poles fastest driver in qualifying), winning three races, finishing in the top five 12 times, and finishing in the top ten 20 times. NASCAR's point system in 2011 allocated 43 pents to the driver who finished first. 42 points to the driver who finished second and so on down to post for the driver who finished in the 43rd position. In addition any driver who led a lap received I beespoint the driver who led the most laps received an additional benus point, and the race winner was awarded bonus points. But the maximum number of points a driver could carinye was 48. The following table shows data for the 2011 season for the top 35 drivers (NASCAR website) These data are contained in the file NASCAR Managerial Report 1. Suppose you wanted to predict Winnings (S) using only the number of poles won (Poles), the number of wins (Wins), the number of top five finishes (Top 5), or the number of top ten finishes (Top 10). Which of these four variables provides the best single predictor of winnings? 2. Develop an estimated regression equation that can be used to predict Winnings (5) given the number of poles won (Poles), the number of wins (Wins), the number of top five finishes (Top 5). and the number of top ten finishes (Top 10). Test for individual significance and discuss your findings and conclusions, 3. Create two new independent variables: Top 2-5 and Top 6-10. Top 2-5 represents the number of times the driver finished between second and fifth place and Top 6-10 Poles + 3 0 3 t Wins 5 1 Driver Tony Stewart Carl Edwards Kevin Harviek Matt Kenseth Brad keselowski Jimmie Johnson Dale Earnhardt Jr. Jeff Gordon Denny Harlin Ryan Newman Kurt Busch Kyle Busch Clint Bawyer Kasey Kahne AJ. Allmendinger Greg Bittle Paul Menard Martin Trex Jr Marcos Ambrose Jeff Burton Juan Montoya Mark Martin David Ragan Points 240) 2400 2345 2330 2319 2304 2290 2287 2284 2284 2262 2246 1047 1041 1013 997 947 937 936 935 932 930 906 3 2 0 3 1 1 2 4 1 1 1 0 3 3 1 0 2. 0 3 Top 5 9 19 9 12 10 14 4 13 5 9 8 14 4 8 1 3 4 3 5 2 2 2 4 Top 10 19 26 19 20 14 21 12 18 14 17 10 18 16 Winnings (5) 6,529,670 8,485.990 6,197,140 6,183,580 5.087,740 6.296,360 4.163,690 5,912,830 5,401,190 5,303.020 5.936,470 6.161.020 5,633,950 4.775,160 4825,560 4,318,050 3,853,690 3,955,560 4 750,390 3,807,780 5,020,780 3,830.910 4,203,660 0 0 1 0 1 NNNDOO 10 10 B 12 12 5 8 10 3 0 0 1 Chapter 7 Lines: Regression CASE PROBLEM 2: CONSUMER RESEARCH. INC. Data were collected on annual income, household nice and annual credit card charges for Consumer characteristics that can be used to predict the amount charged by credit card unen sample of 50 consumers. The following data are contained in the file consumer des and behaviors for a vanety of firms. In one study, a client asked for an investigation of Amount Income Household Amount Income Household ($1000s) Size Charged (5) (S1000s) Sire Charged (5) 54 6 3 5573 54 4016 30 1 2583 30 2 3159 48 32 2 5100 3866 4 34 5 50 5 4742 3586 67 4 5037 31 1564 2 55 50 4070 2 3605 2 37 1 2731 67 5 5345 40 2 3348 55 5370 66 4 4764 52 2 3890 51 3 4110 62 3 4705 25 3 4208 64 2. 4157 46 4 4219 22 3 3579 22 1 2477 29 4 3890 33 2 2514 39 2 2972 65 3 4214 35 1 3121 62 4 4965 39 4 4183 42 6 4412 54 3 3730 21 2 2446 23 6 4127 44 1 2995 27 2 2921 37 5 4171 26 7 4603 62 6 5678 61 2 4273 21 3 3623 30 2 55 3067 7 5301 22 3074 42 2 3020 46 5 41 4820 7 4828 66 5149 Sow Consumer Research, Inc. (www.teborglunyochester profile/secret shopper consumented 0041-45625697) Managerial Report 1. Use methods of descriptive statistics to summarize the data. Comment on the findings 2. Develop estimated regression equations, first using annual income as the independent variable and then using household size as the independent variable. Which variables the better predictor of annual credit card charges? Discuss your findings. 3. Develop an estimated regression equation with annual income and household sites de independent variables. Discuss your findings 4. What is the predicted annual credit card charge for a three-person household with a annual income of $10.00 5. Discuss the need for other independent variables that could be added to the model What additional variables might be helpful? Chapter? Linear Region Top 5 Winnings 3.254,00 Pales Points Driver Wins . Top 10 6 7 5 795 . + 1 0 1 0 0 3 2 2 1 1 1 Dedema 4.51 4794 4,3747 4505.56 1. 2.3 3.229210 0 2 2 0 1 0 0 0 Carey Men 541 Dave Blaney 0 0 Andy Laly 390 D Robby Gordon 0 Yley 0 192 0 0 NASCAR way. 3011. www.cancer.com 2.559 50 represents the number of times the driver finished between sixth and enth plaer De velop an estimated regression equation that can be used to predict Winnings (5) Potes, Wins, Top 2-5 and Top 6-10. Test for individual significance and discuss your findings and conclusions. 4. Based upon the results of your analysis, what estimated regression equation woody recommend using to predict Winnings (5)? Provide an interpretation of the estimated regression coefficients for this equation Case Problem ). Predicting Winnings for NASCAR DE 405 CASE PROBLEM 3. PREDICTING WINNINOS FOR NASCAR DRIVERS Matt Kenseth won the 2012 Daytona 500, the most important race of the NASCAR His win was no surprise became for the 2011 sease be finished forth in the pointstandings with 2330 points, behind Tony Stewart (2403 pente), Carl Edwards (2002) peit), and Kevin Harvick (2345 points). In 2011 he came 56.183.580 by winning three Poles fastest driver in qualifying), winning three races, finishing in the top five 12 times, and finishing in the top ten 20 times. NASCAR's point system in 2011 allocated 43 pents to the driver who finished first. 42 points to the driver who finished second and so on down to post for the driver who finished in the 43rd position. In addition any driver who led a lap received I beespoint the driver who led the most laps received an additional benus point, and the race winner was awarded bonus points. But the maximum number of points a driver could carinye was 48. The following table shows data for the 2011 season for the top 35 drivers (NASCAR website) These data are contained in the file NASCAR Managerial Report 1. Suppose you wanted to predict Winnings (S) using only the number of poles won (Poles), the number of wins (Wins), the number of top five finishes (Top 5), or the number of top ten finishes (Top 10). Which of these four variables provides the best single predictor of winnings? 2. Develop an estimated regression equation that can be used to predict Winnings (5) given the number of poles won (Poles), the number of wins (Wins), the number of top five finishes (Top 5). and the number of top ten finishes (Top 10). Test for individual significance and discuss your findings and conclusions, 3. Create two new independent variables: Top 2-5 and Top 6-10. Top 2-5 represents the number of times the driver finished between second and fifth place and Top 6-10 Poles + 3 0 3 t Wins 5 1 Driver Tony Stewart Carl Edwards Kevin Harviek Matt Kenseth Brad keselowski Jimmie Johnson Dale Earnhardt Jr. Jeff Gordon Denny Harlin Ryan Newman Kurt Busch Kyle Busch Clint Bawyer Kasey Kahne AJ. Allmendinger Greg Bittle Paul Menard Martin Trex Jr Marcos Ambrose Jeff Burton Juan Montoya Mark Martin David Ragan Points 240) 2400 2345 2330 2319 2304 2290 2287 2284 2284 2262 2246 1047 1041 1013 997 947 937 936 935 932 930 906 3 2 0 3 1 1 2 4 1 1 1 0 3 3 1 0 2. 0 3 Top 5 9 19 9 12 10 14 4 13 5 9 8 14 4 8 1 3 4 3 5 2 2 2 4 Top 10 19 26 19 20 14 21 12 18 14 17 10 18 16 Winnings (5) 6,529,670 8,485.990 6,197,140 6,183,580 5.087,740 6.296,360 4.163,690 5,912,830 5,401,190 5,303.020 5.936,470 6.161.020 5,633,950 4.775,160 4825,560 4,318,050 3,853,690 3,955,560 4 750,390 3,807,780 5,020,780 3,830.910 4,203,660 0 0 1 0 1 NNNDOO 10 10 B 12 12 5 8 10 3 0 0 1 Chapter 7 Lines: Regression CASE PROBLEM 2: CONSUMER RESEARCH. INC. Data were collected on annual income, household nice and annual credit card charges for Consumer characteristics that can be used to predict the amount charged by credit card unen sample of 50 consumers. The following data are contained in the file consumer des and behaviors for a vanety of firms. In one study, a client asked for an investigation of Amount Income Household Amount Income Household ($1000s) Size Charged (5) (S1000s) Sire Charged (5) 54 6 3 5573 54 4016 30 1 2583 30 2 3159 48 32 2 5100 3866 4 34 5 50 5 4742 3586 67 4 5037 31 1564 2 55 50 4070 2 3605 2 37 1 2731 67 5 5345 40 2 3348 55 5370 66 4 4764 52 2 3890 51 3 4110 62 3 4705 25 3 4208 64 2. 4157 46 4 4219 22 3 3579 22 1 2477 29 4 3890 33 2 2514 39 2 2972 65 3 4214 35 1 3121 62 4 4965 39 4 4183 42 6 4412 54 3 3730 21 2 2446 23 6 4127 44 1 2995 27 2 2921 37 5 4171 26 7 4603 62 6 5678 61 2 4273 21 3 3623 30 2 55 3067 7 5301 22 3074 42 2 3020 46 5 41 4820 7 4828 66 5149 Sow Consumer Research, Inc. (www.teborglunyochester profile/secret shopper consumented 0041-45625697) Managerial Report 1. Use methods of descriptive statistics to summarize the data. Comment on the findings 2. Develop estimated regression equations, first using annual income as the independent variable and then using household size as the independent variable. Which variables the better predictor of annual credit card charges? Discuss your findings. 3. Develop an estimated regression equation with annual income and household sites de independent variables. Discuss your findings 4. What is the predicted annual credit card charge for a three-person household with a annual income of $10.00 5. Discuss the need for other independent variables that could be added to the model What additional variables might be helpful
Step by Step Solution
There are 3 Steps involved in it

Get step-by-step solutions from verified subject matter experts