

Question: When a process is in control, it results in there being, on average, 16 defects per unit of output. C-chart limits of 4 and 28
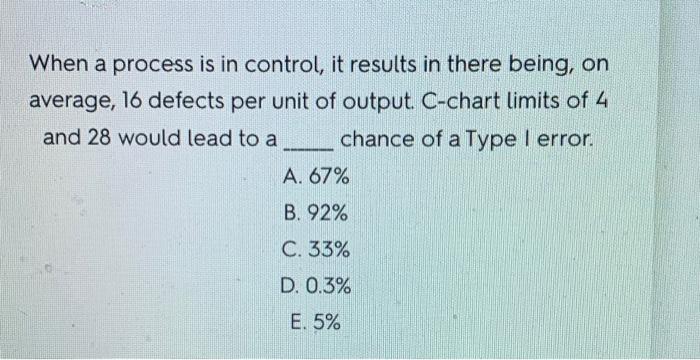
When a process is in control, it results in there being, on average, 16 defects per unit of output. C-chart limits of 4 and 28 would lead to a chance of a Type I error.
Step by Step Solution
There are 3 Steps involved in it
1 Expert Approved Answer
Step: 1 Unlock

Question Has Been Solved by an Expert!
Get step-by-step solutions from verified subject matter experts
Step: 2 Unlock
Step: 3 Unlock