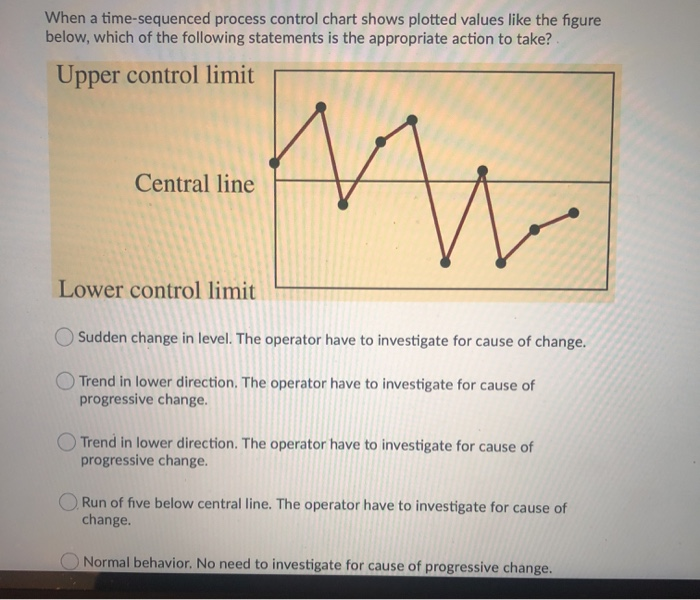
Question: When a time-sequenced process control chart shows plotted values like the figure below, which of the following statements is the appropriate action to take? Upper

When a time-sequenced process control chart shows
When a time-sequenced process control chart shows plotted values like the figure below, which of the following statements is the appropriate action to take? Upper control limit Central line Lower control limit Sudden change in level. The operator have to investigate for cause of change. Trend in lower direction. The operator have to investigate for cause of progressive change. Trend in lower direction. The operator have to investigate for cause of progressive change. Run of five below central line. The operator have to investigate for cause of change. Normal behavior. No need to investigate for cause of progressive change

Step by Step Solution

There are 3 Steps involved in it

1 Expert Approved Answer
Step: 1 Unlock blur-text-image
Question Has Been Solved by an Expert!

Get step-by-step solutions from verified subject matter experts

Step: 2 Unlock
Step: 3 Unlock

Students Have Also Explored These Related General Management Questions!