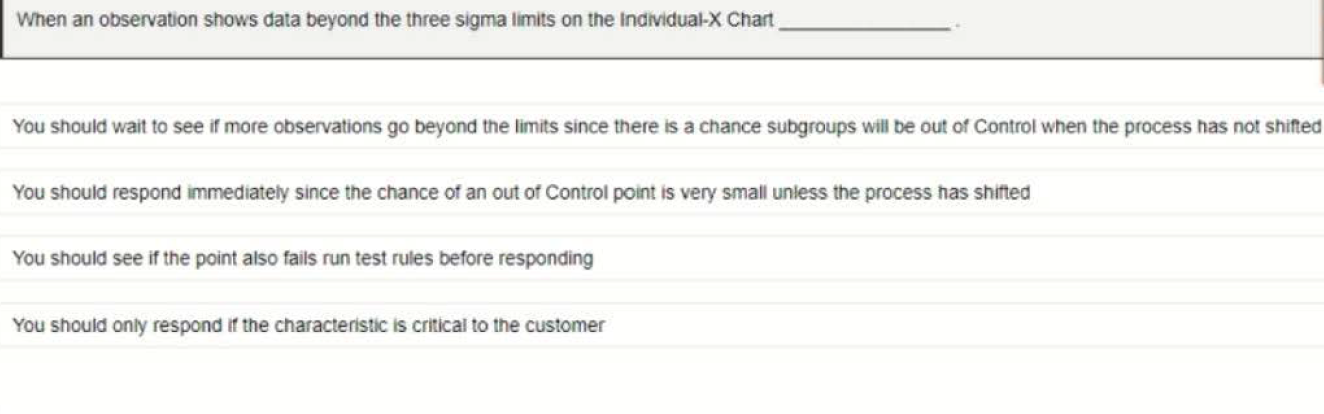
Question: When an observation shows data beyond the three sigma limits on the Individual-X Chart You should wait to see if more observations go beyond the

When an observation shows data beyond the threeWhen an observation shows data beyond the three

When an observation shows data beyond the three sigma limits on the Individual-X Chart You should wait to see if more observations go beyond the limits since there is a chance subgroups will be out of control when the process has not shifted You should respond immediately since the chance of an out of Control point is very small unless the process has shifted You should see if the point also fails run test rutes before responding You should only respond if the characteristic is critical to the customer Instead of using +/- 3 sigma for the Control Limits on a Control Chart you decide to use +/- 2 sigma in order to simplify your data analysis. The risk of this approach is Nothing because Control Limits are fixed by the customer specification Nothing because nearly all (95%) of the data falls within +/- 2 sigma A Type 1 Error because you conclude the process is out-of-control when in fact it is in-control A Type Il Error because you conclude the process is in-control when in fact it is out-of-control

Step by Step Solution

There are 3 Steps involved in it

1 Expert Approved Answer
Step: 1 Unlock blur-text-image
Question Has Been Solved by an Expert!

Get step-by-step solutions from verified subject matter experts

Step: 2 Unlock
Step: 3 Unlock

Students Have Also Explored These Related General Management Questions!