

Question: When calculating statistics from data, it is important to recognize when you are working with a population or a sample. In general, a population
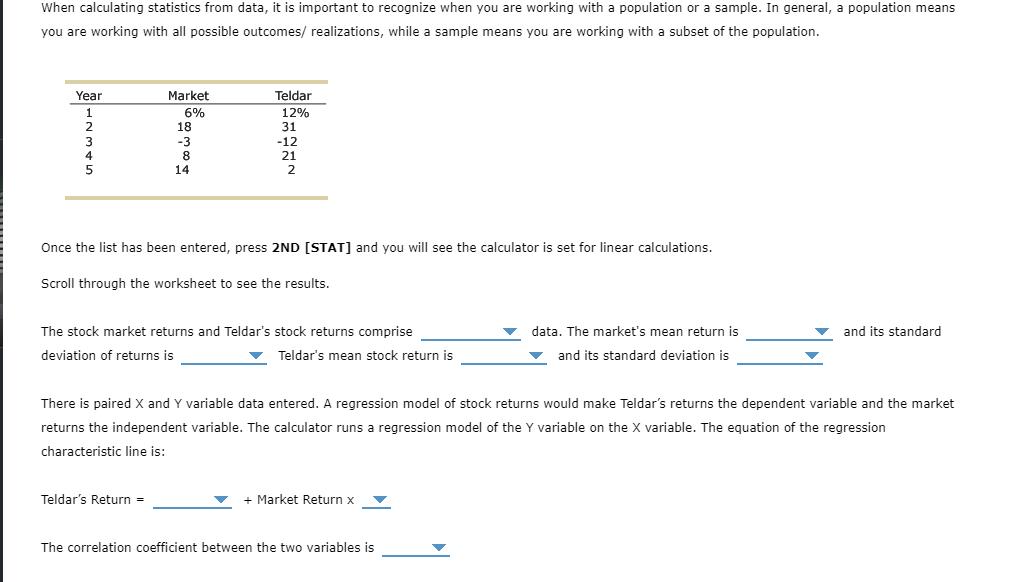
When calculating statistics from data, it is important to recognize when you are working with a population or a sample. In general, a population means you are working with all possible outcomes/ realizations, while a sample means you are working with a subset of the population. Year 1 2 3 4 Market 6% 18 -3 8 14 Teldar 12% 31 Teldar's Return = -12 21 2 Once the list has been entered, press 2ND [STAT] and you will see the calculator is set for linear calculations. Scroll through the worksheet to see the results. The stock market returns and Teldar's stock returns comprise deviation of returns is Teldar's mean stock return is There is paired X and Y variable data entered. A regression model of stock returns would make Teldar's returns the dependent variable and the market returns the independent variable. The calculator runs a regression model of the Y variable on the X variable. The equation of the regression characteristic line is:: + Market Return x data. The market's mean return is and its standard deviation is The correlation coefficient between the two variables is and its standard When calculating statistics from data, it is important to recognize when you are working with a population or a sample. In general, a population means you are working with all possible outcomes/ realizations, while a sample means you are working with a subset of the population. Year 1 2 3 4 Market 6% 18 -3 8 14 Teldar 12% 31 Teldar's Return = -12 21 2 Once the list has been entered, press 2ND [STAT] and you will see the calculator is set for linear calculations. Scroll through the worksheet to see the results. The stock market returns and Teldar's stock returns comprise deviation of returns is Teldar's mean stock return is There is paired X and Y variable data entered. A regression model of stock returns would make Teldar's returns the dependent variable and the market returns the independent variable. The calculator runs a regression model of the Y variable on the X variable. The equation of the regression characteristic line is:: + Market Return x data. The market's mean return is and its standard deviation is The correlation coefficient between the two variables is and its standard When calculating statistics from data, it is important to recognize when you are working with a population or a sample. In general, a population means you are working with all possible outcomes/ realizations, while a sample means you are working with a subset of the population. Year 1 2 3 4 Market 6% 18 -3 8 14 Teldar 12% 31 Teldar's Return = -12 21 2 Once the list has been entered, press 2ND [STAT] and you will see the calculator is set for linear calculations. Scroll through the worksheet to see the results. The stock market returns and Teldar's stock returns comprise deviation of returns is Teldar's mean stock return is There is paired X and Y variable data entered. A regression model of stock returns would make Teldar's returns the dependent variable and the market returns the independent variable. The calculator runs a regression model of the Y variable on the X variable. The equation of the regression characteristic line is:: + Market Return x data. The market's mean return is and its standard deviation is The correlation coefficient between the two variables is and its standard
Step by Step Solution
3.38 Rating (167 Votes )
There are 3 Steps involved in it
SOLUTION To calculate the statistics and regression results w... View full answer

Get step-by-step solutions from verified subject matter experts