

Question: When creating a chart using seaborn, it is possible to make formatting changes to the chart using matplotlib code. True False Question 7 Matplotlib is
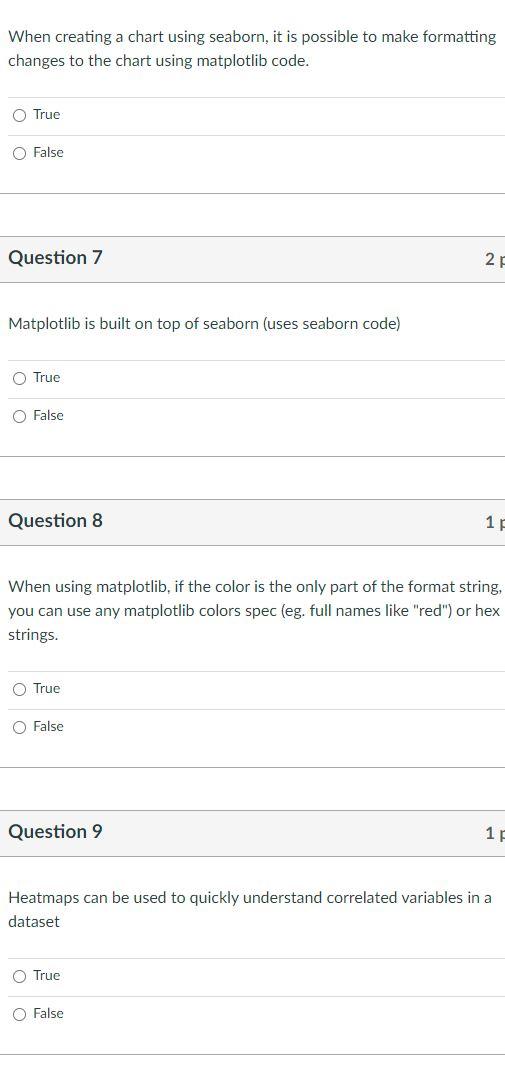
When creating a chart using seaborn, it is possible to make formatting changes to the chart using matplotlib code. True False Question 7 Matplotlib is built on top of seaborn (uses seaborn code) True False Question 8 When using matplotlib, if the color is the only part of the format string, you can use any matplotlib colors spec (eg. full names like "red") or hex strings. True False Question 9 Heatmaps can be used to quickly understand correlated variables in a dataset True False
Step by Step Solution
There are 3 Steps involved in it
1 Expert Approved Answer
Step: 1 Unlock

Question Has Been Solved by an Expert!
Get step-by-step solutions from verified subject matter experts
Step: 2 Unlock
Step: 3 Unlock