

Question: When looking at this chart I had trouble noticing what is something that is noticeable or perhaps could make a claim.do you notice? What can
When looking at this chart I had trouble noticing what is something that is noticeable or perhaps could make a claim.do you notice? What can I wonder? What was curious about that comes from what you notice in the graph?What's going on in this graph? Summarize the graph's main ideas.
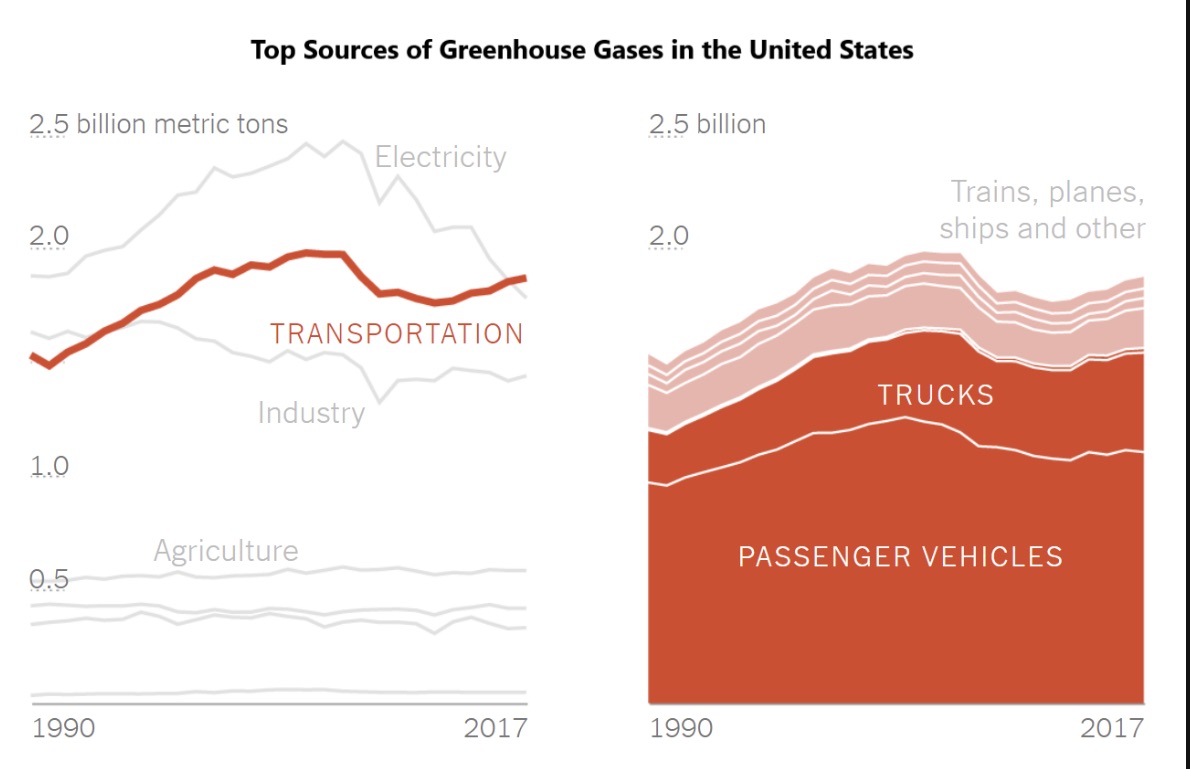
Top Sources of Greenhouse Gases in the United States 2.5 billion metric tons 2.0 TRANSPORTATION 1.0 0.5 1990 2017 2.5 billion 2.0 1990 PASSENGER VEHICLES 2017
Step by Step Solution
There are 3 Steps involved in it
1 Expert Approved Answer
Step: 1 Unlock

Question Has Been Solved by an Expert!
Get step-by-step solutions from verified subject matter experts
Step: 2 Unlock
Step: 3 Unlock