

Question: When tracing, please include a chart with the step number, n value, i value, and output. Suppose we have a list of numbers, representing daily
When tracing, please include a chart with the step number, n value, i value, and output.
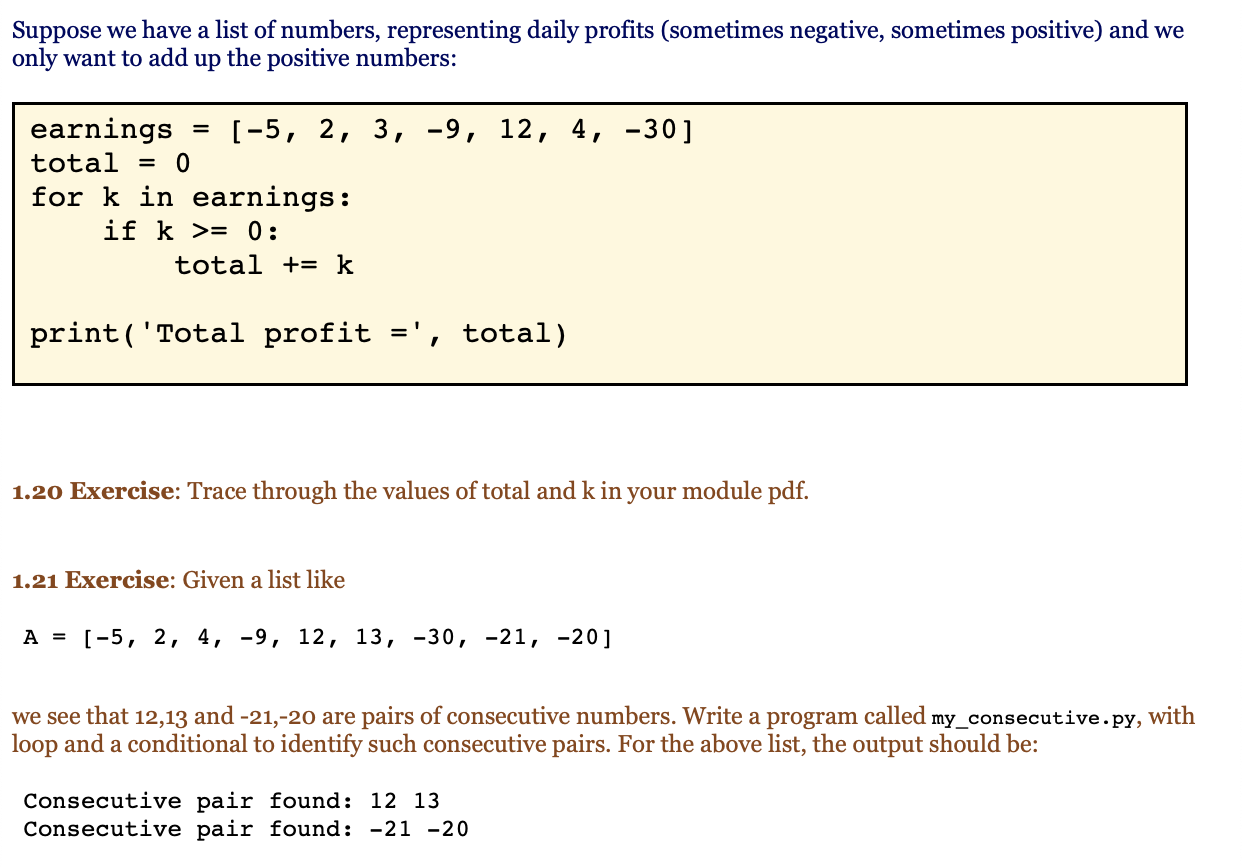
Suppose we have a list of numbers, representing daily profits (sometimes negative, sometimes positive) and we only want to add up the positive numbers: earnings [-5, 2, 3, -9, 12, 4, -30] total = 0 for k in earnings: if k >= 0: total += k print('Total profit =', total) 1.20 Exercise: Trace through the values of total and kin your module pdf. 1.21 Exercise: Given a list like A = [-5, 2, 4, -9, 12, 13, -30, -21, -20] we see that 12,13 and -21,-20 are pairs of consecutive numbers. Write a program called my_consecutive.py, with loop and a conditional to identify such consecutive pairs. For the above list, the output should be: Consecutive pair found: 12 13 Consecutive pair found: -21 -20
Step by Step Solution
There are 3 Steps involved in it

Get step-by-step solutions from verified subject matter experts