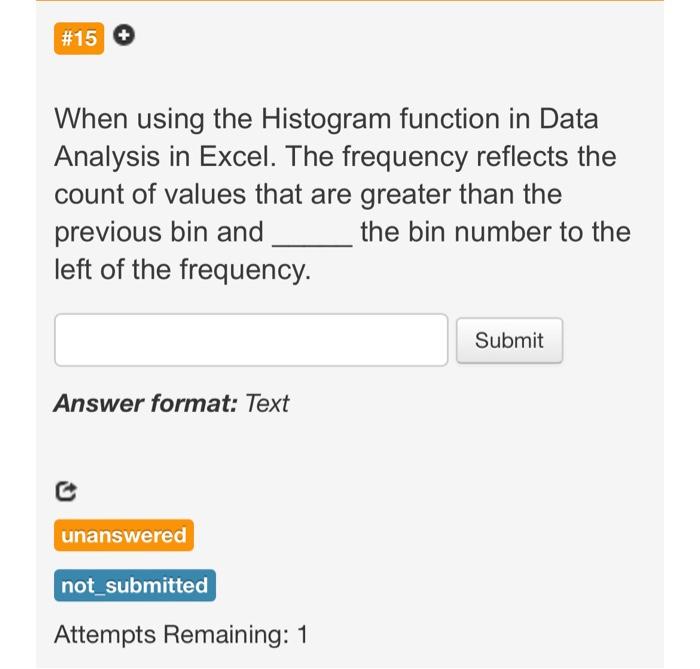
Question: When using the Histogram function in Data Analysis in Excel. The frequency reflects the count of values that are greater than the previous bin and.

When using the Histogram function in Data
When using the Histogram function in Data Analysis in Excel. The frequency reflects the count of values that are greater than the previous bin and. the bin number to the left of the frequency. Answer format: Text E Attempts Remaining: 1 In Bayes Theorem, | stands for Answer format: Text Attempts Remaining: 1

Step by Step Solution

There are 3 Steps involved in it

1 Expert Approved Answer
Step: 1 Unlock blur-text-image
Question Has Been Solved by an Expert!

Get step-by-step solutions from verified subject matter experts

Step: 2 Unlock
Step: 3 Unlock

Students Have Also Explored These Related General Management Questions!