

Question: when you answer this please put in bold the correct answers for each blank. The previous answer i got for this only had (A3) correct
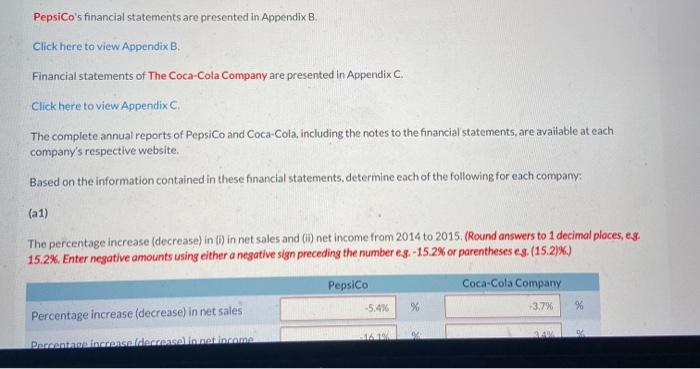
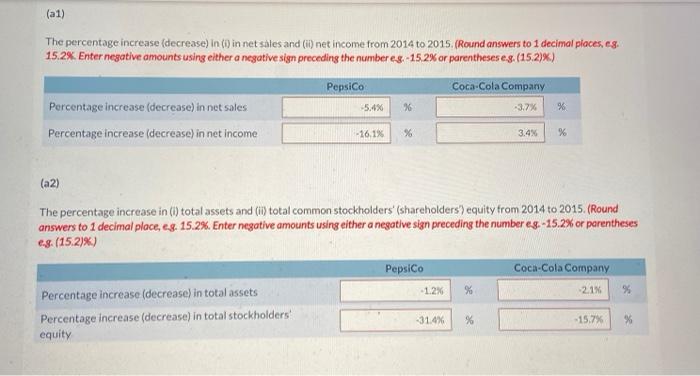
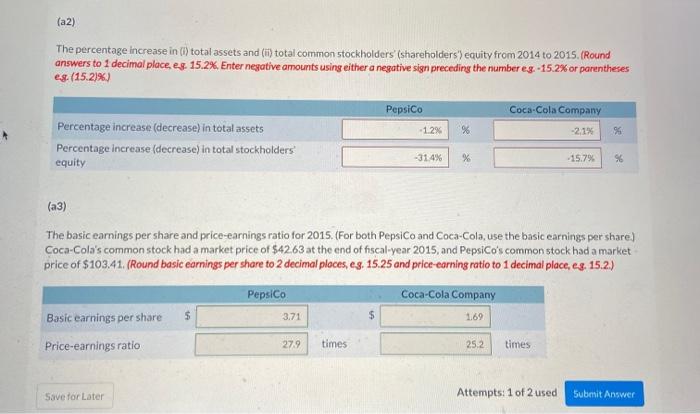
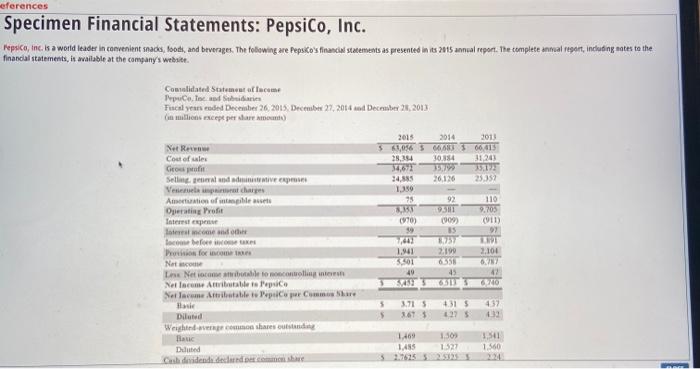
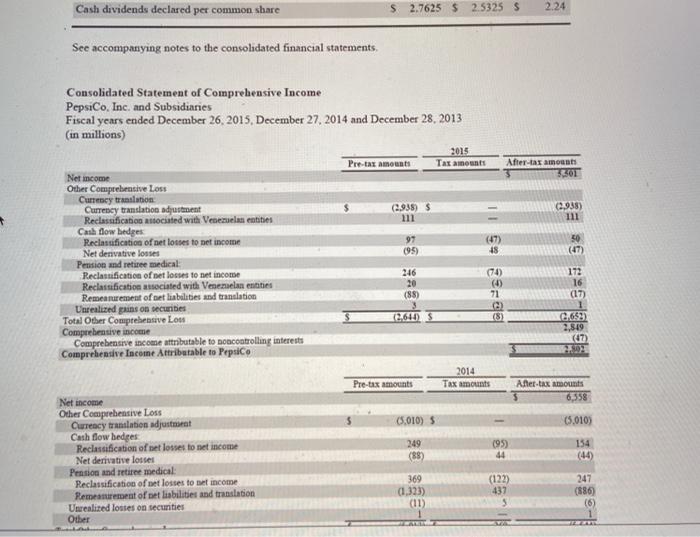
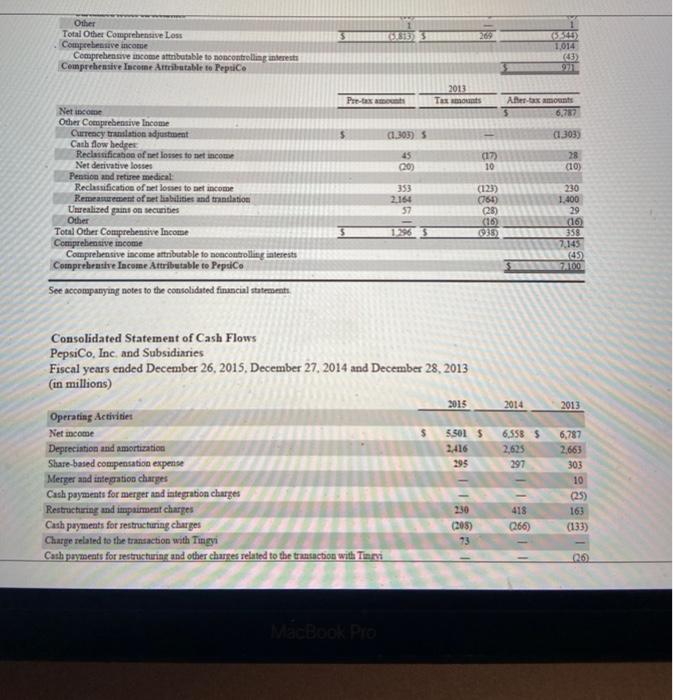
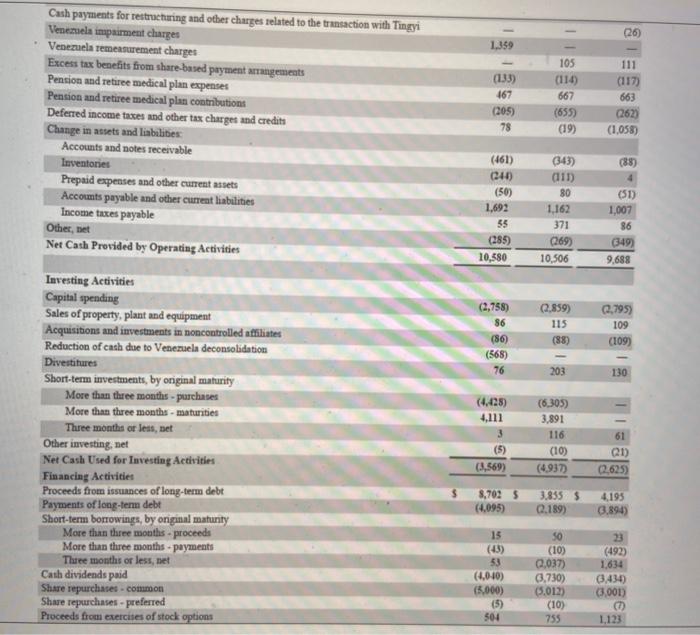
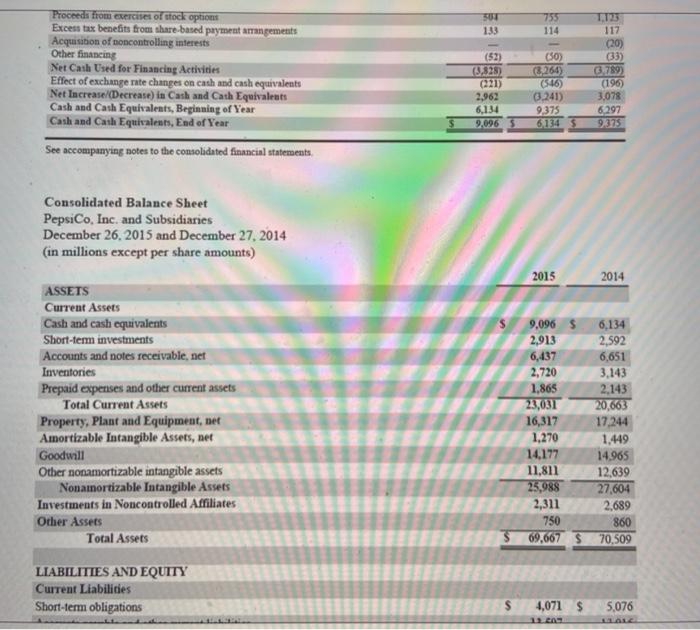
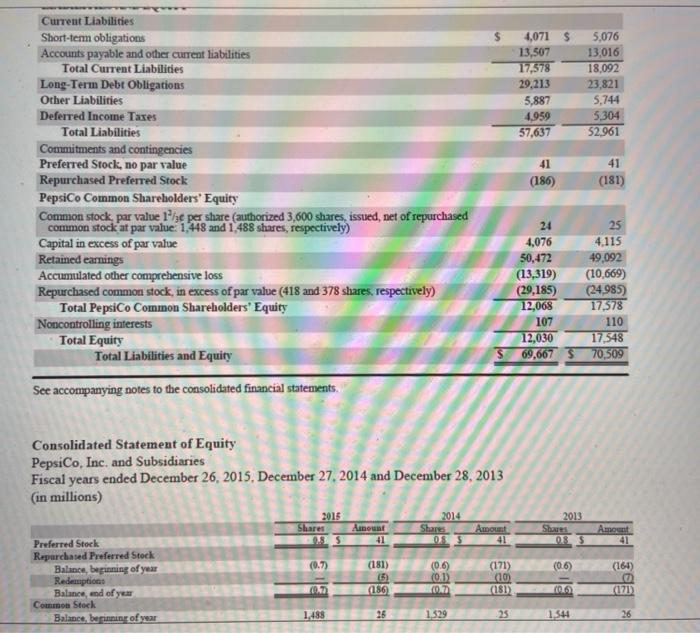
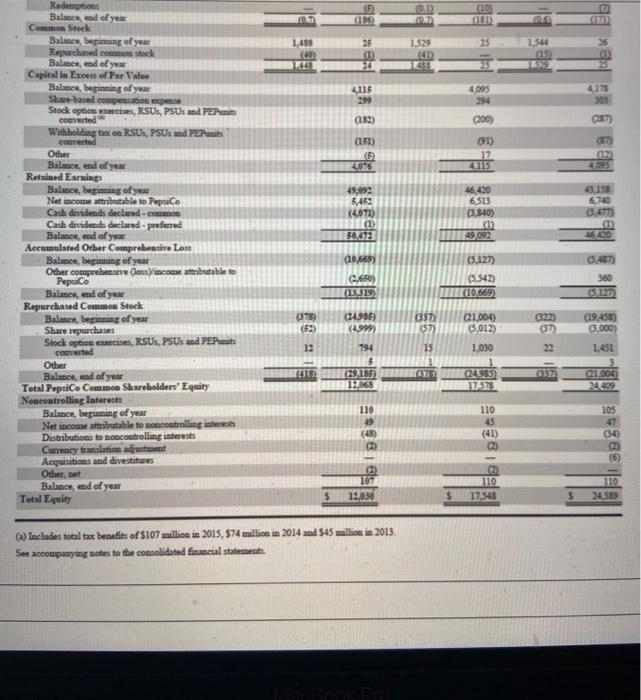
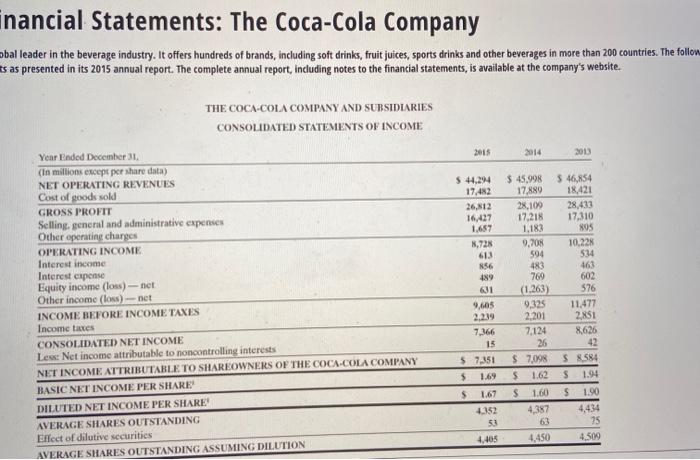
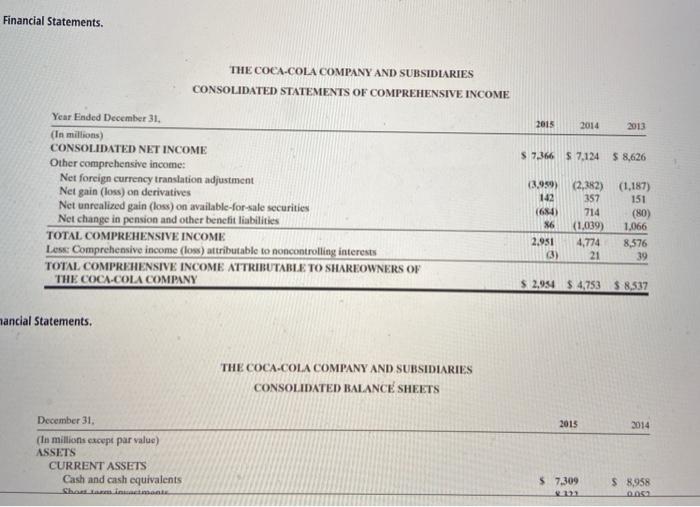
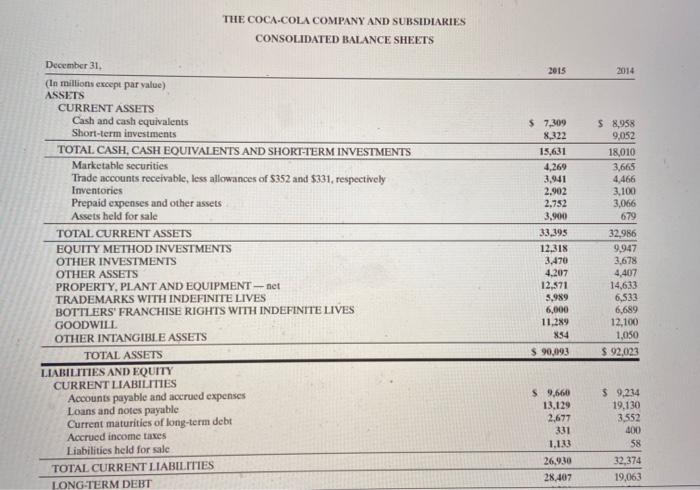
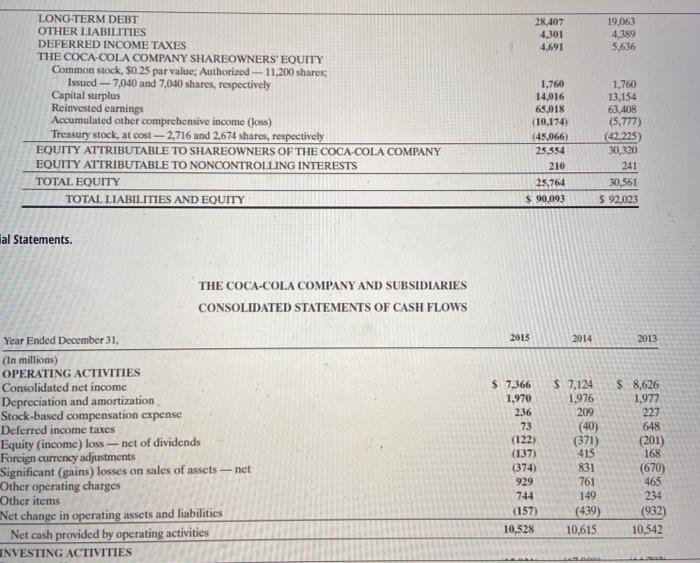
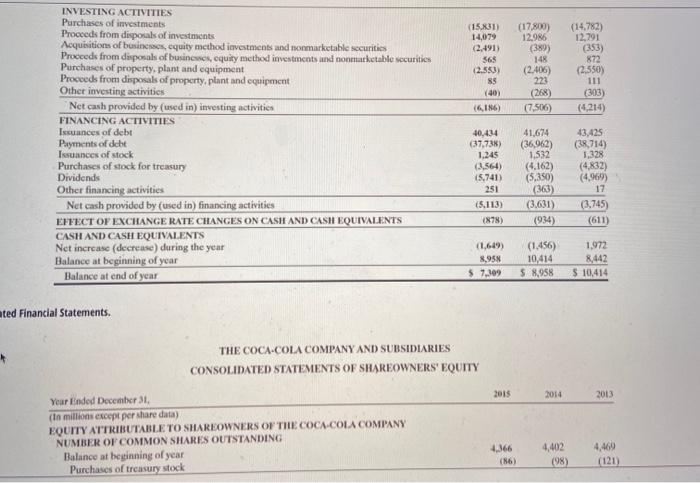
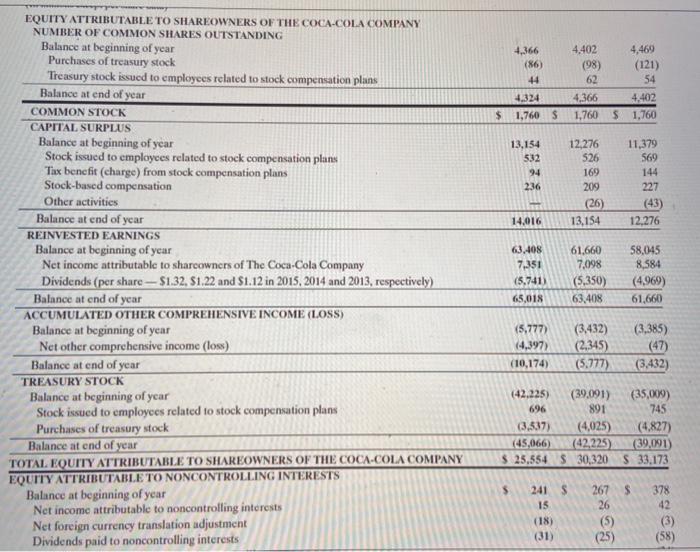
PepsiCo's financial statements are presented in Appendix B. Click here to view Appendix B. Financial statements of The Coca-Cola Company are presented in Appendix C. Click here to view Appendix C. The complete annual reports of PepsiCo and Coca-Cola, including the notes to the financial statements are available at each company's respective website, Based on the information contained in these financial statements, determine each of the following for each company: (a 1) The percentage increase (decrease) in () in net sales and (W) net income from 2014 to 2015. (Round answers to 1 decimal places, es 15.2%. Enter negative amounts using either a negative sign preceding the number es. -15.2% or parentheses es. (15.2)%.) PepsiCo Coca-Cola Company -3.7% -5.4% % % Percentage increase (decrease) in net sales Daccantosincrocode.dalinnatin.com (21) The percentage increase (decrease) In (0) in net sales and (ii) net income from 2014 to 2015. (Round answers to 1 decimal places, eg. 15.2%. Enter negative amounts using either a negative sign preceding the number es. -15.2% or parentheses eg. (15.27%) PepsiCo Coca-Cola Company Percentage increase (decrease) in net sale -54% Percentage increase (decrease) in net income % % -3.7% % -16.1% % 3.4% (a2) The percentage increase in (1) total assets and (ii) total common stockholders' (shareholders') equity from 2014 to 2015. (Round answers to 1 decimal place, e.g. 15.2%. Enter negative amounts using either a negative sign preceding the number eg.-15.2% or parentheses eg. (15.2)%) PepsiCo 12% Coca-Cola Company -2.1% % % Percentage increase (decrease in total assets Percentage increase (decrease) In total stockholders equity 31.4% % 15.7% % (a2) The percentage increase in (i)total assets and (ii) total common stockholders (shareholders') equity from 2014 to 2015. (Round answers to 1 decimal place, es. 15.2%. Enter negative amounts using either a negative sign preceding the number eg.-15.2% or parentheses eg. (15.2%) Coca-Cola Company PepsiCo -12% %6 Percentage increase (decrease in total assets Percentage increase (decrease) in total stockholders -2,1% % equity -314% % -15.79. 96 (a3) The basic earnings per share and price-earnings ratio for 2015. (For both PepsiCo and Coca-Cola, use the basic earnings per share) Coca-Cola's common stock had a market price of $42.63 at the end of fiscal year 2015, and PepsiCo's common stock had a market price of $103.41. (Round basic earnings per share to 2 decimal places, es. 15.25 and price-earning ratio to 1 decimal place, es. 15.2.) PepsiCo Coca-Cola Company Basic earnings per share Price-earnings ratio S 3.71 $ 1.69 27.9 times 25.2 times Save for Later Attempts: 1 of 2 used Submit Answer eferences Specimen Financial Statements: PepsiCo, Inc. Pepsico, inc. is a world leader in convenient snacks, food, and beverages. The following are PepsiCo's financial statements as presented in ts 2015 annual report. The complete annual report, including mates to the financial statements, is available at the company's website Comalidated States of locum Pepelne od stiri Fuent years ended December 26, 2015 December 27, 2014 and December 21, 2013 in millions except per dare mot) Cout of sales Grapati Selling to do IVERPO Vesel paint charges Amortion of please Operating Profit Intersex latest income and the face Position for com Nato Le Netcom wbtile to controlling into Nelleme Anvil price Yerleme Arabile Popis por C 2015 2014 2013 5 $1,056 33 66.45 214 30854 31.24 19 351 26.126 25.252 1.350 75 92 110 950 9.705 (070) 85 97 2257 1.941 2199 2.104 S3501 49 45 42 437 5 5 3.71 3675 $ Diluted Weigimon shares of 1469 1.415 1.500 1.527 3,541 1.560 Danted Cash dividends declared per common share $ 2.7625 $ 2.5325$ 2.24 See accompanying notes to the consolidated financial statements, Consolidated Statement of Comprehensive Income PepsiCo. Inc. and Subsidiaries Fiscal years ended December 26, 2015, December 27, 2014 and December 28, 2013 (in millions) Pretax amounts 2015 Tax amounts After-tax amounts 3301 (2.938) $ 1 0.938) 111 97 (95) (47) 18 (47) Net income Other Comprehensive Loss Currency translation Currency translation adjustment Reclassification associated with Venezuelan entities Cash flow hedges Reclassification of net losses to net income Net denvative losses Pension and retiree medical Reclassification of net losses to net income Reclassification associated with Venezuela entities Remearurement of net habilities and translation Unrealized prins on securities Total Other Comprehensive Lou Comprehensive income Comprehensive income attributable to encontrolling interests Comprehensive Income Attributable to PepsiCo 172 246 20 (88) (74) () 71 c (8) (17) (264) 0,653) 2,819 (47) 2014 Tax amounts Pre-tax amounts After tax amounts 6,558 05.010) 5 05.010) 154 Net income Other Comprehensive Loss Currency translation adjust Cash flow hedges Reclassification of net losses to set income Net derivative losses Pension and retire medical Reclassification of net losses to set income Remeasurement of or liabilities and translation Unrealized losses on secunties Other 249 (88) 44 369 (1.323) (11) (122) 437 247 (886) (6) 1 13 269 Other Total Other Comprehensive Loss Comprehensive income Comprehensive come attributable to noncontrolling interest Comprehensive Income Attributable to Pepulco (545) 1,014 (63) 9 2013 Taxmorants Pre-texamen Aer tax amounts 6,787 (1303) (1303) 45 00) (17) 10 28 (10) 230 Netico Other Comprehensive Income Currency translation adjustumat Cash flow hedger Reclassification of net losses to the income Net derivative losses Pention and reture medical Reclassification of net losses to net income Remeasurement of thisbilities and translation Unrealized gains on securities Other Total Other Comprehensive Income Comprehensive income Comprehensive income attributable to encontrolling interests Counprebrative Income Attributable to PepsiCo See accompanying notes to the consolidated financial statements 353 2.164 57 (123) (760) (28) (16) 935 1.400 29 (16) 358 7.145 45 7A100 Consolidated Statement of Cash Flows PepsiCo, Inc. and Subsidiaries Fiscal years ended December 26, 2015, December 27, 2014 and December 28, 2013 (in millions) 2015 2014 2013 $ 5.5015 2416 295 6,5585 2,625 297 Operating Activities Net income Depreciation and amortization Share-based compensation expertise Merger and integration charges Cash payments for merger and integration charges Restructuring and impaiment charges Cash payments for restructuring charges Charge related to the transaction with Tingyi Cash payments for restructuring and other charges related to the transaction with Tinni 6,787 2.663 303 10 (25) 163 (133) 230 (205) 73 418 066) 20 Book Pro (26) 1.359 Cash payments for restructuring and other charges related to the transaction with Tingyi Venezuela impairment charges Venezuela remeasurement charges Excess tax benefits from share based payment arrangements Pension and retiree medical plan expenses Pension and retiree medical plan contributions Deferred income taxes and other tax charges and credits Change in assets and liabilities: Accounts and notes receivable Inventories Prepaid expenses and other current assets Accommts payable and other current liabilities Income taxes payable Othernet Net Cash Provided by Operating Activities (133) 467 (205) 78 105 (114) 667 (655) (19) (117) 663 (262) (1.058) (343) (111) (461) (340) (50) 1,692 55 80 1,162 371 (269) 10,506 (88) 4 (51) 1,007 86 (349) 9.688 (285) 10.580 (3,758) 86 (86) (2.859) 115 (88) 0,795) 109 (109) (565) 76 203 130 Investing Activities Capital spending Sales of property, plant and equipment Acquisitions and investments in noncontrolled affiliates Reduction of cash due to Venezuela deconsolidation Divestitures Short-term investments, by original maturity More than three months - purchases More than three months - maturities Three months or less, net Other investing, net Net Cash Used for Investing Activities Financing Activities Proceeds from issuances of long-term debt Payments of long-term debe Short-term borrowings, by original matunity More than three months - proceeds More than three months - payments Three months or less, net Cath dividends paid Share repurchases - common Share repurchases-preferred Proceeds from exercises of stock options 4,111 3 (5) (3,569) (6,305) 3,891 116 (10) (4937 61 (1) 0.625) 8,7025 (4,095) 3.855 $ 0.189) 4.195 0.894) 15 (43) 53 (4.0-10) (5,000) (5) 504 50 (10) 0,037) (3,730) (5.012) (10) 755 23 (492) 1.634 3,434) (3,001) 1.123 755 114 133 Proceeds from exercises of stock options Excess tax benefits from share-based payment arrangements Acquisition of noncontrolling interests Other financing Net Cash Used for Financing Activities Effect of exchange rate changes on cash and cash equivalents Net Increase/Decrease) in Cash and Cath Equivalents Cash and Cash Equivalents, Beginning of Year Cash and Cath Equivalents, End of Year See accompanying notes to the comsolidated financinl statements. (52) (3.825) (221) 2,962 6,134 2.096 (50) (3,260) (546) (3.241) 9,375 6,134 5 117 (20) (33) 3.789) (196) 3,078 6.297 9.375 Consolidated Balance Sheet PepsiCo, Inc. and Subsidiaries December 26, 2015 and December 27, 2014 (in millions except per share amounts) 2015 2014 ASSETS Current Assets Cash and cash equivalents Short-term investments Accounts and notes receivable, net Inventories Prepaid expenses and other current assets Total Current Assets Property, Plant and Equipment, net Amortizable Intangible Assets, net Goodwill Other nonamortizable intangible assets Nonamortizable Intangible Assets Investments in Noncontrolled Affiliates Other Assets Total Assets 9,096 5 2,913 6,437 2,720 1.865 23,031 16,317 1,270 14.177 11,811 25,988 2,311 750 $ 69,667 $ 6,134 2,592 6,651 3.143 2,143 20,663 17,244 1.449 14.965 12,639 27,604 2,689 860 70,509 LIABILITIES AND EQUITY Current Liabilities Short-term obligations 4,071 $ 5,076 11 4,071 $ 13,507 17,578 29,213 5,887 4.959 57,637 5,076 13,016 18,092 23,821 5,744 5.304 52,961 41 (186) 41 (181) Current Liabilities Short-term obligations Accounts payable and other current liabilities Total Current Liabilities Long-Term Debt Obligations Other Liabilities Deferred Income Taxes Total Liabilities Commitments and contingencies Preferred Stock, no par value Repurchased Preferred Stock PepsiCo Common Shareholders' Equity Common stock par value 11se per share (authorized 3,600 shares, issued, net of repurchased common stock at par value: 1,448 and 1,488 shures, respectively) Capital in excess of par value Retained earnings Accumulated other comprehensive loss Repurchased common stock, in excess of par value (418 and 378 shares, respectively) Total PepsiCo Common Shareholders' Equity Noncontrolling interests Total Equity Total Liabilities and Equity 24 25 4,076 4,115 50,472 49,092 (13,319) (10,669) (29,185) (24.985) 12,068 17.578 107 110 12,030 17,548 69,667 $ 70,509 See accompanying notes to the consolidated financial statements 2013 Consolidated Statement of Equity PepsiCo, Inc. and Subsidiaries Fiscal years ended December 26, 2015, December 27, 2014 and December 28, 2013 in millions) 2015 2014 Shares Amount Share Amount Preferred Stock 41 Repurchased Preferred Stock Balance, beginning of year (0.7) (181) (0.6) (171) Redemption (01) 00 Balance, and of year . (186 (181) Common Stock Balance, beginning of year 1.488 26 1.529 25 08S Amount 41 (06) (160) 16 (171) 1.544 (10 (15 25 1,485 (46) 36 0 9 1.529 40 1544 05 4116 4095 303 (181) 000) 037) (151) OD 17 4.115 4,076 4095 49,092 5453 (4.671) (1) 46.420 6,513 0.840 LO 49,092 0 Redemptions Balance, and of year Commes Stock Balance, being of year Repurchased common stock Balance, and of year Capital in Excess of Par Value Balance, beginning of year She-based compensato per Stock options, RSUS, PSUs and PEPts Converted Withholding tax on RSU PSUs and PEPts Cetted Other Balance end of year Retained Earning Balance, beginning of year Net income attributable to PepsiCo Cash dividends decland- Cash dividends declared predned Balance, and of year Accumulated Other Comprehensive Lom Balance, beginning of year Other comprehensive Clocco attributable to PepsiCo Balance, and of year Repurchased Common Stock Balance, beginning of year Share repurchases Stock option series RSU, PSUs and PEPt. Converted Other Balance, and of year Total PepsiCo Comune Shareholders' Equity Noncontrolling Interest Balance, beaning of year Net income attributable to controlling interest Distributions to no controlling interests Currency translatos adjust Acquisitions and divestitures Other Det Balance, ead of year Total Equity 0.66 05.12D (5.542) (10 669) C.650) (1319) 360 (378) (52) (24985) (1.999) (337) 37 1.000) 3,012) (19.455) 3.000) 12 794 IS 1.030 1.451 1413 (9.185) 67 11.06 64955 1.000 105 110 49 (45) 110 45 (41) (6) 107 12.030 110 17.545 110 24399 (a) Includes total tax benefits of $107 million in 2015, 874 million in 2014 and 545 million in 2013. See accompanying notes to the consolidated financial statements. inancial Statements: The Coca-Cola Company mbal leader in the beverage industry. It offers hundreds of brands, including soft drinks, fruit juices, sports drinks and other beverages in more than 200 countries. The follow ts as presented in its 2015 annual report. The complete annual report, including notes to the financial statements, is available at the company's website. THE COCA-COLA COMPANY AND SUBSIDIARIES CONSOLIDATED STATEMENTS OF INCOME 2015 2014 301 $ 44.294 17,482 26.812 16,427 8,728 613 Year Ended December 31 (In millions except per share data) NET OPERATING REVENUES Cost of goods sold GROSS PROFIT Selling, general and administrative expenses Other operating charges OPERATING INCOME Interest income Interest cipense Equity income (los) - net Other income (loss) - net INCOME BEFORE INCOME TAXES Income taxes CONSOLIDATED NET INCOME Les Net income attributable to noncontrolling interests NET INCOME ATTRIBUTABLE TO SHAREOWNERS OF THE COCA-COLA COMPANY BASIC NET INCOME PER SHARE DILUTED NET INCOME PER SHARE AVERAGE SHARES OUTSTANDING Effect of dilutive securities AVERAGE SHARES OUTSTANDING ASSUMING DILUTION 189 $ 45,998 17,889 28,109 17.218 1,183 9,708 594 483 760 (1.263) 9,325 2,201 7.124 26 $7,098 S 1.62 $ 1.60 $ 46,854 18,421 28,433 17,310 SOS 10.228 534 463 602 576 11.477 2.851 8.626 9.605 7.166 15 $ 7.351 $ 1.69 $ 8.584 $ 1.94 S 1.90 $ 1.67 4.152 53 4.405 25 4,509 4,450 Financial Statements. THE COCA-COLA COMPANY AND SUBSIDIARIES CONSOLIDATED STATEMENTS OF COMPREHENSIVE INCOME 2015 2014 2013 $ 7,366 $ 7,124 $ 8,626 Year Ended December 31. (In millions) CONSOLIDATED NET INCOME Other comprehensive income: Net foreign currency translation adjustment Net gain (loss) on derivatives Net unrealized gain (loss) on available-for-sale securities Net change in pension and other benefit liabilities TOTAL COMPREHENSIVE INCOME Lese Comprehensive income (los) attributable to noncontrolling interests TOTAL COMPREHENSIVE INCOME ATTRIBUTABLE TO SHAREOWNERS OF THE COCA-COLA COMPANY (3.959) 142 (684) 86 714 (2,382) (1.187) 357 151 (80) (1,039) 4,774 8,576 21 39 1,066 2.931 (3) $ 2,954 $4,753 58,537 mancial Statements. THE COCA-COLA COMPANY AND SUBSIDIARIES CONSOLIDATED BALANCE SHEETS 2013 2014 December 31 (in millions except par value) ASSETS CURRENT ASSETS Cash and cash equivalents Shas inamani $ 7,309 $ 8958 THE COCA-COLA COMPANY AND SUBSIDIARIES CONSOLIDATED BALANCE SHEETS 2015 2014 December 31, (In millions except par value) ASSETS CURRENT ASSETS Cash and cash equivalents Short-term investments TOTAL CASH, CASH EQUIVALENTS AND SHORT-TERM INVESTMENTS Marketable securities Trade accounts receivable, less allowances of $352 and $331, respectively Inventories Prepaid expenses and other assets Assets held for sale TOTAL CURRENT ASSETS EQUITY METHOD INVESTMENTS OTHER INVESTMENTS OTHER ASSETS PROPERTY, PLANT AND EQUIPMENT - net TRADEMARKS WITH INDEFINITE LIVES BOTTLERS' FRANCHISE RIGHTS WITH INDEFINITE LIVES GOODWILL OTHER INTANGIBLE ASSETS TOTAL ASSETS LIABILITIES AND EQUITY CURRENT LIABILITIES Accounts payable and accrued expenses Loans and notes payable Current maturities of long-term debt Accrued income taxes Liabilities held for sale TOTAL CURRENT LIABILITIES LONG-TERM DEBT $ 7,309 8,322 15.631 4,269 3,941 2.902 2.752 3,900 33.395 12.318 3.470 4.207 12.571 5.989 6,000 11,289 854 $ 90,093 $ 8,958 9,052 18,010 3,665 4.466 3,100 3,066 679 32,986 9,947 3,678 4,407 14,633 6,533 6,689 12,100 1,050 $ 92,023 59.660 13.129 2,677 331 1.133 26,9.30 28.407 $ 9,234 19,130 3,552 400 58 32,374 19,063 28,407 4.301 4,691 19.063 4,389 5,636 LONG-TERM DEBT OTHER LIABILITIES DEFERRED INCOME TAXES THE COCA-COLA COMPANY SHAREOWNERS' EQUITY Common stock, 30.25 par value: Authorized -- 11,200 shares Issued 7,040 and 7,040 shares, respectively Capital surplus Reinvested carnings Accumulated other comprehensive income (loss) Treasury stock, at cost - 2,716 and 2,674 shares, respectively EQUITY ATTRIBUTABLE TO SHAREOWNERS OF THE COCA-COLA COMPANY EQUITY ATTRIBUTABLE TO NONCONTROLLING INTERESTS TOTAL EQUITY TOTAL LIABILITIES AND EQUITY 1,760 14,016 65,018 (10,174) (45,066) 25,354 210 25.764 $ 90,093 1,760 13,154 63,408 (5,777) (42.225) 30,320 241 30,561 $ 92,023 Jal Statements. THE COCA-COLA COMPANY AND SUBSIDIARIES CONSOLIDATED STATEMENTS OF CASH FLOWS 2015 2014 2013 Year Ended December 31, (In millions) OPERATING ACTIVITIES Consolidated net income Depreciation and amortization Stock-based compensation expense Deferred income taxes Equity (income) loss -- net of dividends Foreign currency adjustments Significant (gains) losses on sales of assets --- net Other operating charges Other items Net change in operating assets and liabilities Net cash provided by operating activities INVESTING ACTIVITIES $ 7,366 1,970 236 73 (122) (137) (374) 929 744 (157) 10,528 $ 7,124 1976 209 (40) (371) 415 831 761 149 (439) 10,615 $ 8,626 1,977 227 648 (201) 168 (670) 465 234 (932) 10,542 (15.831) 14,079 (2.491) 365 (2.553) 85 (40) (17,800) 12.986 (389) 148 (2.405) 223 (268) (7,506 (14762) 12,791 (353) 872 (2.550) 111 (303) (4,214) INVESTING ACTIVITIES Purchases of investments Proceeds from disposals of investments Acquisitions of business, equity method investments and nonmarketable securities Proceeds from disposals of businewes, equity method investments and nonmarketable securities Purchases of property, plant and equipment Proceeds from disposals of property, plant and equipment Other investing activities Net cash provided by (used in) investing activities FINANCING ACTIVITIES Issuances of debt Payments of deht Issuances of stock Purchases of stock for treasury Dividends Other financing activities Net cash provided by (used in) financing activities EFFECT OF EXCHANGE RATE CHANGES ON CASH AND CASH EQUIVALENTS CASH AND CASH EQUIVALENTS Net increase (decrease) during the year Balance at beginning of year Balance at end of year 40,434 (37.735) 1.245 (3.564) 15,741 251 (5.113) (878) 41,674 (36.962) 1.532 (4.162) (5,350) (363) 43,425 (38,714) 1,328 (4,832) (4.969) 17 (3.745) (611) (934) (1,649) 8,95 $ 7,309 (1.456) 10,414 5 8,958 1.972 8,442 $ 10,414 ated Financial Statements THE COCA-COLA COMPANY AND SUBSIDIARIES CONSOLIDATED STATEMENTS OF SHAREOWNERS' EQUITY 2015 2014 2013 Year Ended December 31, (In millions except per share data) EQUITY ATTRIBUTABLE TO SHAREOWNERS OF THE COCA-COLA COMPANY NUMBER OF COMMON SHARES OUTSTANDING Balance at beginning of year Purchases of treasury stock 4.366 (86) 4,402 (98) 4,469 (121) 4,366 (86) 44 (121) 4,402 4,469 (98) 62 54 4,366 4,402 1,760 $ 1,760 4.324 1,760 $ $ 13,154 532 94 236 12.276 526 169 209 11,379 569 144 227 (43) 12.276 14.016 13,154 EQUITY ATTRIBUTABLE TO SHAREOWNERS OF THE COCA-COLA COMPANY NUMBER OF COMMON SHARES OUTSTANDING Balance at beginning of year Purchases of treasury stock Treasury stock issued to employees related to stock compensation plans Balance at end of year COMMON STOCK CAPITAL SURPLUS Balance at beginning of year Stock issued to employees related to stock compensation plans Tax benefit (charge) from stock compensation plans Stock-based compensation Other activities Balance at end of year REINVESTED EARNINGS Balance at beginning of year Net income attributable to sharcowners of The Coca-Cola Company Dividends (per share --- $1.32. S1.22 and S1.12 in 2015, 2014 and 2013, respectively) Balance at end of year ACCUMULATED OTHER COMPREHENSIVE INCOME (LOSS) Balance at beginning of year Net other comprehensive income (loss) Balance at end of year TREASURY STOCK Balance at beginning of year Stock issued to employees related to stock compensation plans Purchases of treasury stock Balance at end of year TOTAL EQUITY ATTRIBUTABLE TO SHAREOWNERS OF THE COCA-COLA COMPANY EQUITY ATTRIBUTABLE TO NONCONTROLLING INTERESTS Balance at beginning of year Net income attributable to noncontrolling interests Net foreign currency translation adjustment Dividends paid to noncontrolling interests 63.408 7,351 (5,741) 65,018 61.660 7,098 (5,350) 63,408 58,045 8,584 (4,969) 61,660 (3,385) (5,777) (4,3272 (10,174) (3.432) (2,345) (5.777) (3,432) (42.325) (39.091) (35,009) 696 891 745 (3,537) (4,025) (4.827) (45,066) (42,225) (39,091) $ 25,554 $ 30,320 S 33.173 5 S S 378 42 241 15 (18) (31) 267 26 (5) (25) (58) 236 209 (26) 13,154 227 (43) 12.276 14,016 63.405 7,351 (5,741) 65,018 61,660 7,098 (5,350) 63,408 58045 8,584 (4.969) 61,660 (3,385) (5.777) (4.397) (10,174) (3,432) (2,345) (5.777) (3,432) Stock-based compensation Other activities Balance at end of year REINVESTED EARNINGS Balance at beginning of year Net income attributable to shareowners of The Coca-Cola Company Dividends (per share --- $1.32, S1.22 and 51.12 in 2015, 2014 and 2013, respectively) Balance at end of year ACCUMULATED OTHER COMPREHENSIVE INCOME (LOSS) Balance at beginning of year Net other comprehensive income (loss) Balance at end of year TREASURY STOCK Balance at beginning of year Stock issued to employees related to stock compensation plans Purchases of treasury stock Balance at end of year TOTAL EQUITY ATTRIBUTABLE TO SHAREOWNERS OF THE COCA-COLA COMPANY EQUITY ATTRIBUTABLE TO NONCONTROLLING INTERESTS Balance at beginning of year Not income attributable to noncontrolling interests Net foreign currency translation adjustment Dividends paid to noncontrolling interests Acquisition of interests held by noncontrolling owners Contributions by noncontrolling interests Business combinations Deconsolidation of certain entitics Other activities TOTAL EQUITY ATTRIBUTABLE TO NONCONTROLLING INTERESTS (42.225) (39,091) (35,009) 696 891 745 (3,537) (4.025) (4.827) (45,066) (42.225 (39,091) $ 25,554 $ 30,320 S 33.173 $ 241 $ 15 (18) (31) 2675 26 (5) 378 42 (34) (3) 6 210 S $ 2415 267
Step by Step Solution
There are 3 Steps involved in it

Get step-by-step solutions from verified subject matter experts