

Question: When you draw a graph for options hedge, which one show the euro equivalent amount as the exchange rate changes? Y-axis shows the euro amount
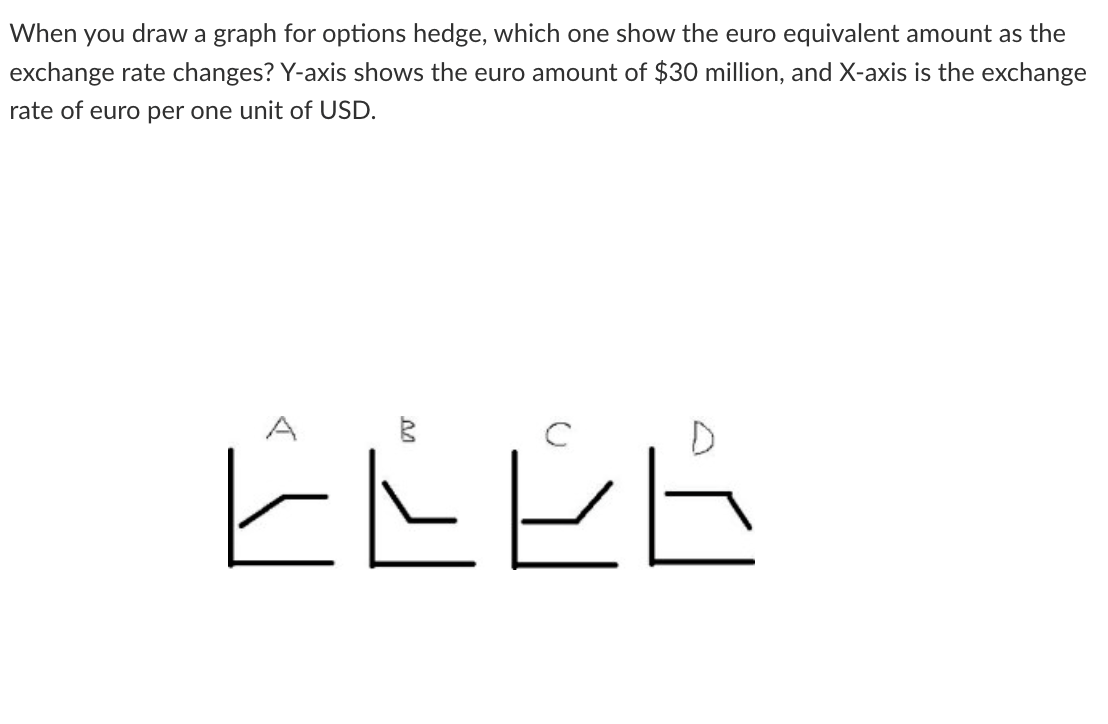
When you draw a graph for options hedge, which one show the euro equivalent amount as the exchange rate changes? Y-axis shows the euro amount of $30 million, and X-axis is the exchange rate of euro per one unit of USD. A E ELE
Step by Step Solution
There are 3 Steps involved in it
1 Expert Approved Answer
Step: 1 Unlock

Question Has Been Solved by an Expert!
Get step-by-step solutions from verified subject matter experts
Step: 2 Unlock
Step: 3 Unlock