

Question: When you look at the visualization, you notice that some companies have a significant drop from the average gross profit to sales percentage to the
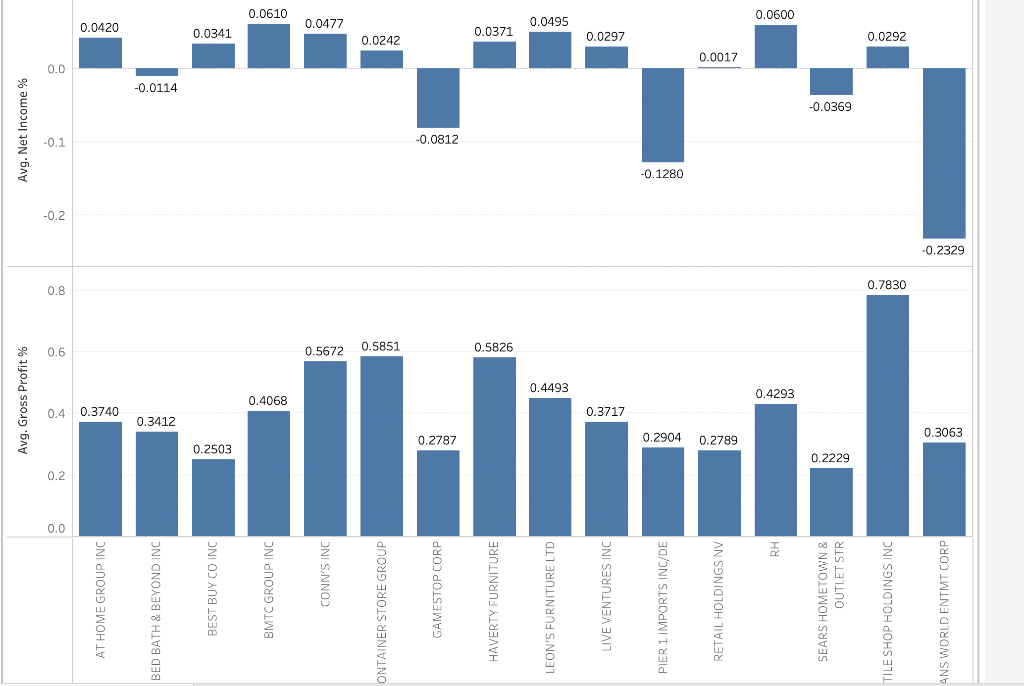 When you look at the visualization, you notice that some companies have a significant drop from the average gross profit to sales percentage to the average net income to sales percentage while others do not though their average gross profit to sales ratios are not too high. How can we explain these differences?
Avg. Gross Profit % Avg. Net Income % 0.8 9 AT HOME GROUP INC 0.3740 0.0420 BED BATH & BEYOND INC CIVO -0.0114 BEST BUY CO INC 0.0341 BMTC GROUP INC 0.4068 0.0610 CONN'S INC 0.0477 illo 0.5672 0.5851 ONTAINER STORE GROUP 0.0242 GAMESTOP CORP 0.2787 -0.0812 HAVERTY FURNITURE 0.5826 0.0371 0.0495 LEON'S FURNITURE LTD 0.4493 LIVE VENTURES INC 0.3717 0.0297 PIER 1 IMPORTS INC/DE -0.1280 0.2904 0.2789 RETAIL HOLDINGS NV Z1000 RH 0.4293 0.0600 SEARS HOMETOWN & OUTLET STR 0.2229 -0.0369 TILE SHOP HOLDINGS INC 0.7830 0.0292 ANS WORLD ENTMT CORP 0.3063 -0.2329
Step by Step Solution
There are 3 Steps involved in it

Get step-by-step solutions from verified subject matter experts