

Question: Where do you live? The U.S. Census Bureau computed the proportion of U.S. residents who lived in each of four geographic regions in Year A.
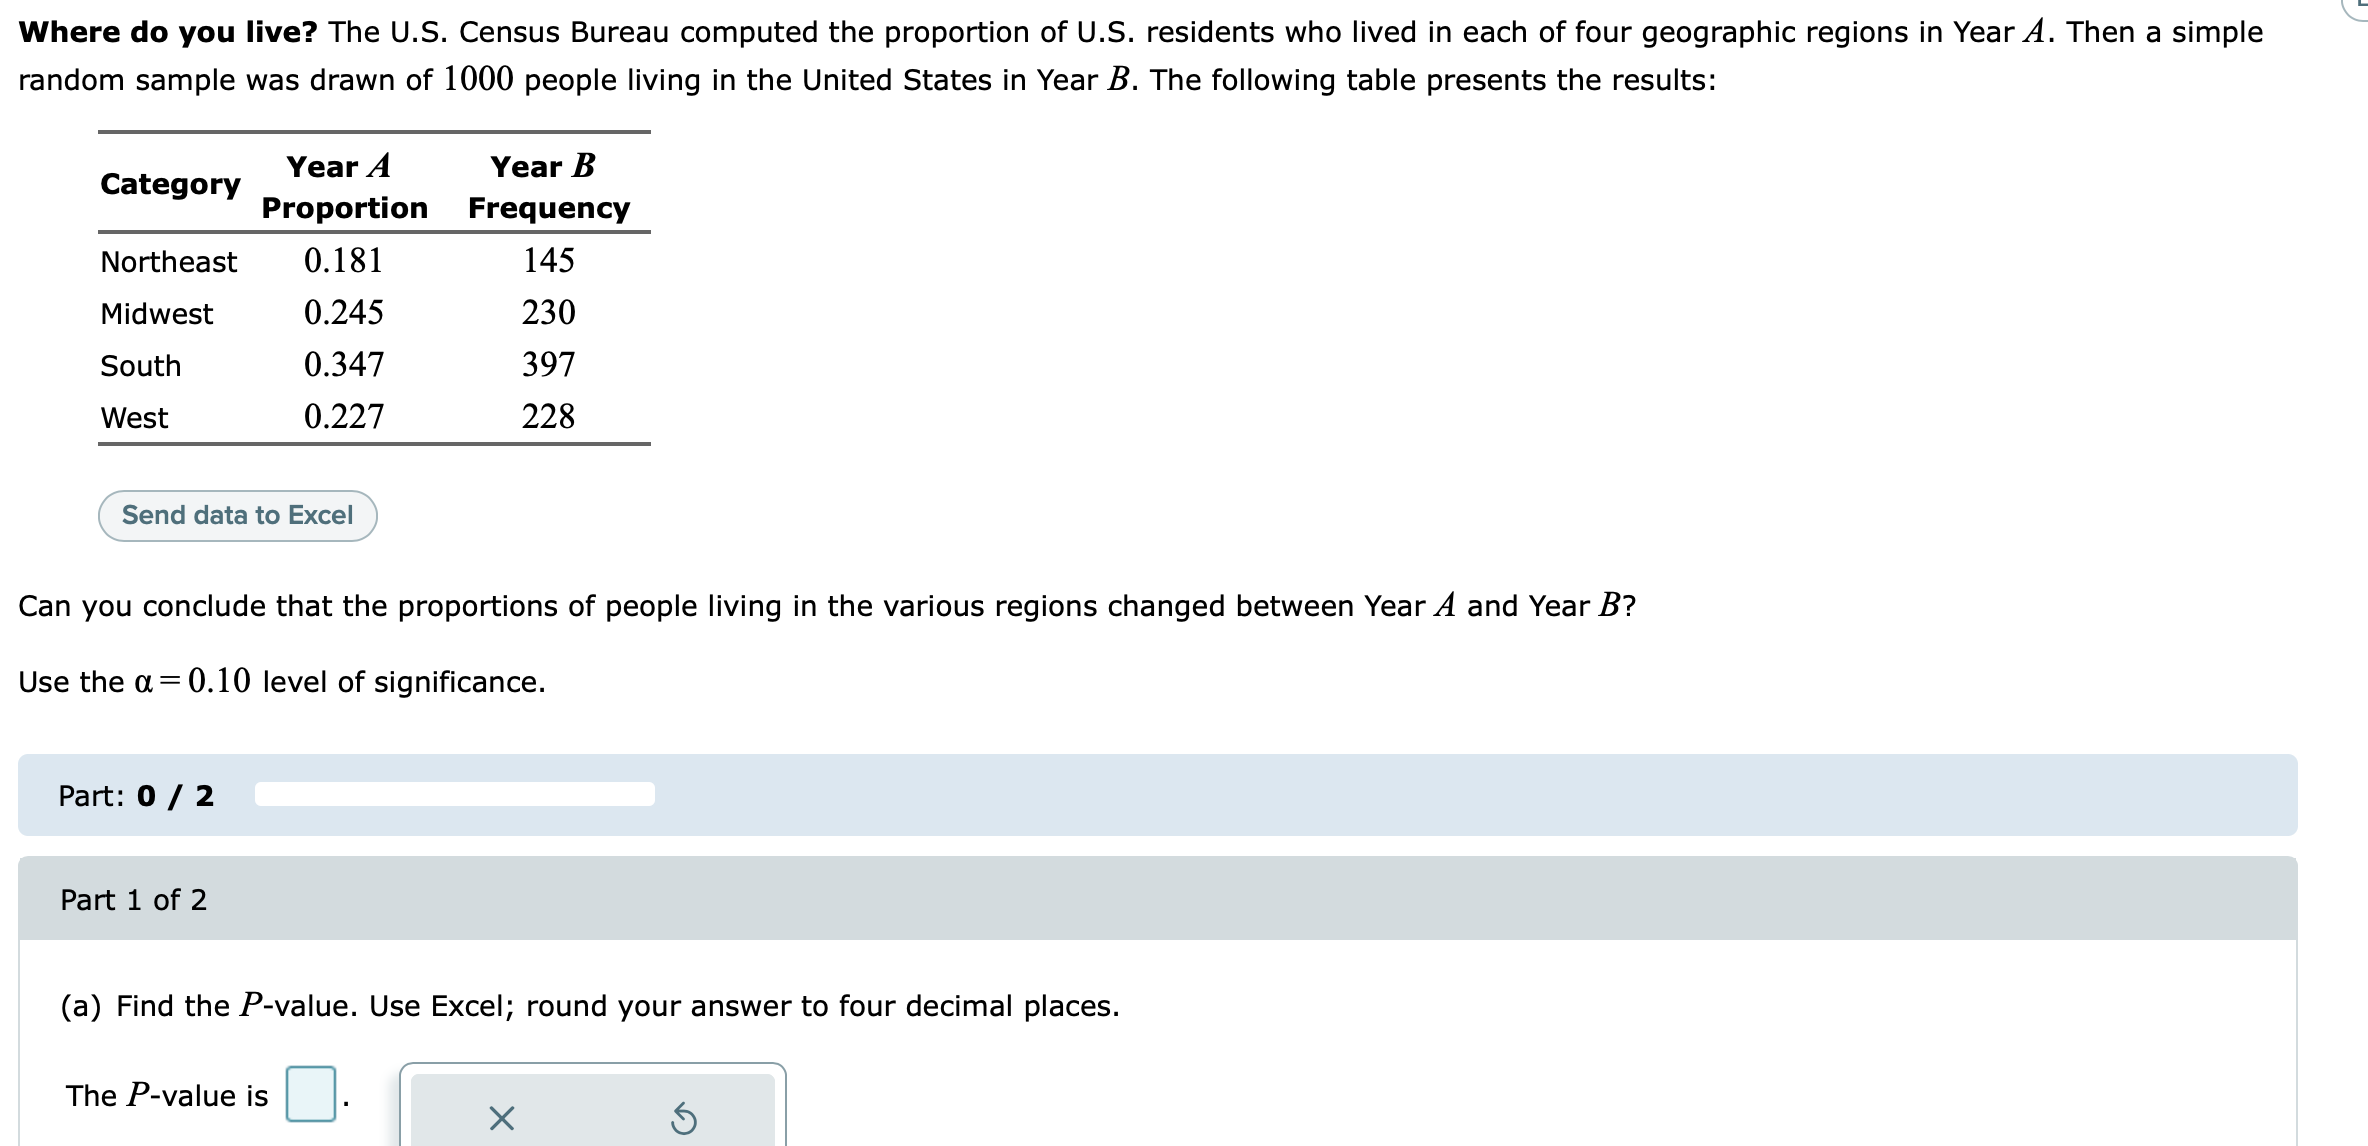


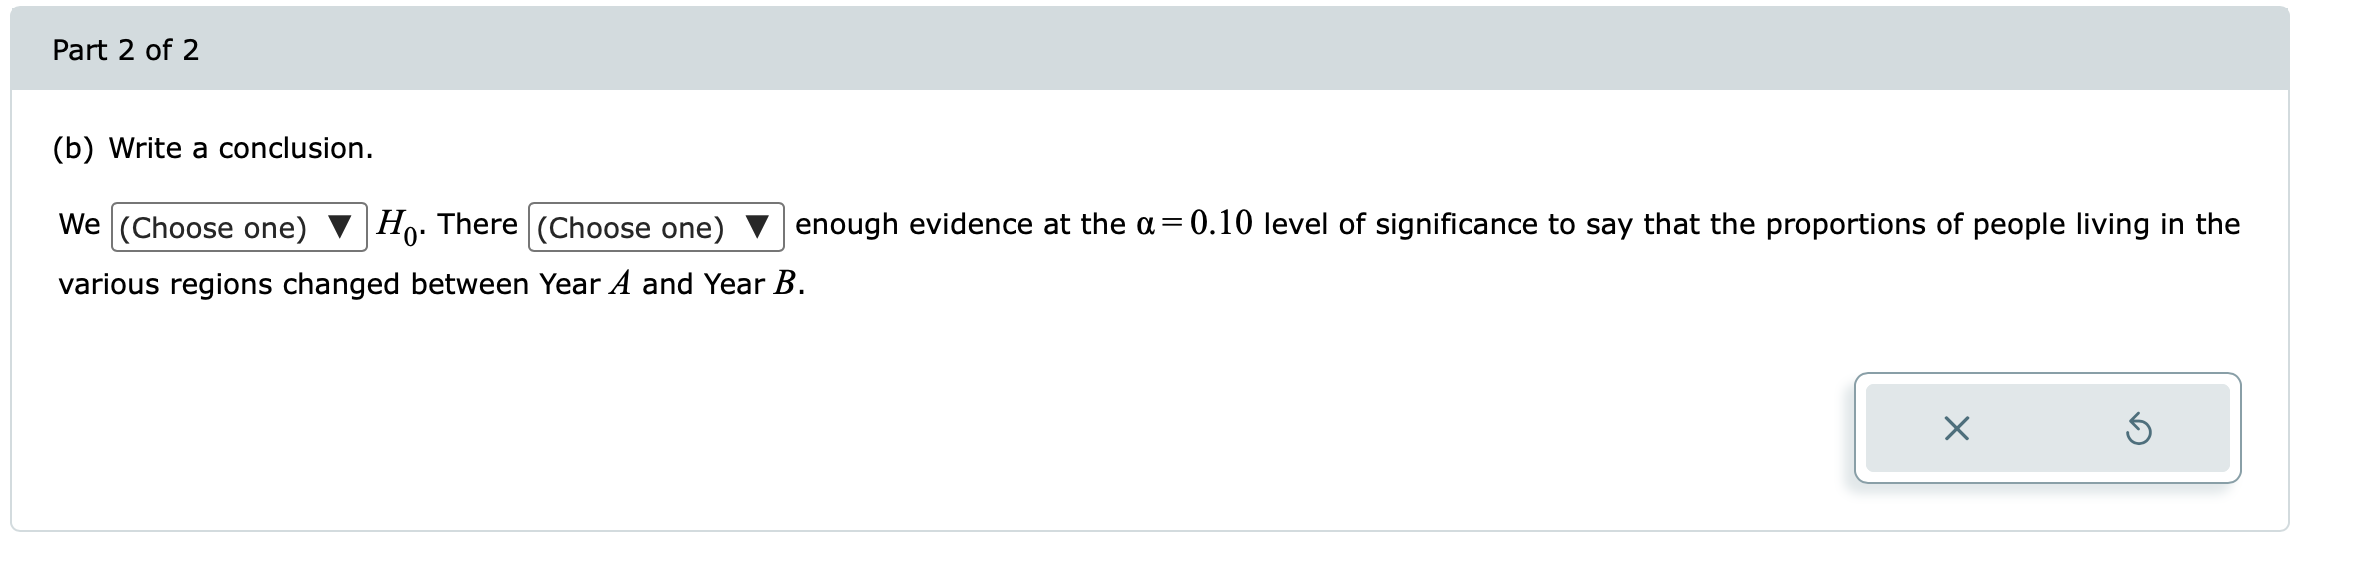
Where do you live? The U.S. Census Bureau computed the proportion of U.S. residents who lived in each of four geographic regions in Year A. Then a simple random sample was drawn of 1000 people living in the United States in Year B. The following table presents the results: Year A Year B Category Proportion Frequency Northeast 0.181 145 Midwest 0.245 230 South 0.347 397 West 0.227 228 Send data to Excel Can you conclude that the proportions of people living in the various regions changed between Year A and Year B? Use the a = 0.10 level of significance. Part: 0 / 2 Part 1 of 2 (a) Find the P-value. Use Excel; round your answer to four decimal places. The P-value is X 5Part 2 of 2 (b) Write a conclusion. We (Choose one) V Ho. There (Choose one) V enough evidence at the a = 0.10 level of significance to say that the proportions of people living in the various regions changed between Year A and Year B. X
Step by Step Solution
There are 3 Steps involved in it

Get step-by-step solutions from verified subject matter experts