

Question: where in these 4 scripts is an example of : a function that has one or more input arguments a function that has one or
where in these 4 scripts is an example of : a function that has one or more input arguments a function that has one or more output arguments a function with no input arguments a function with no output arguments
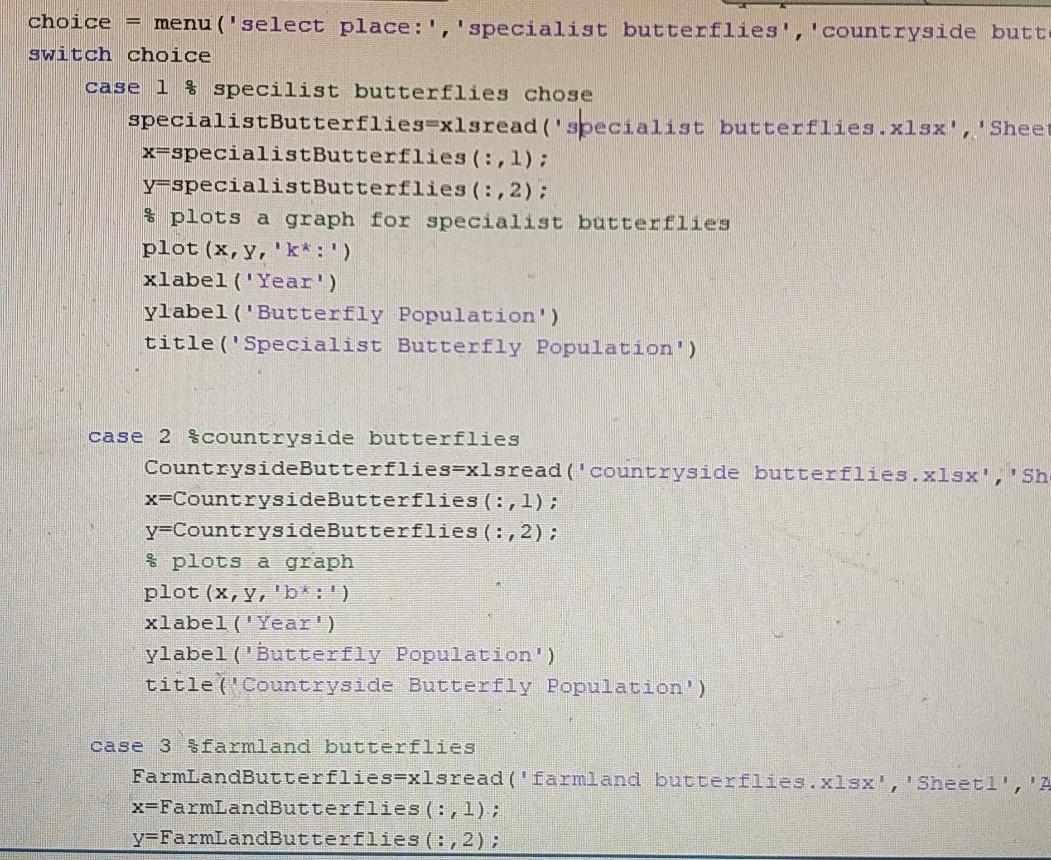
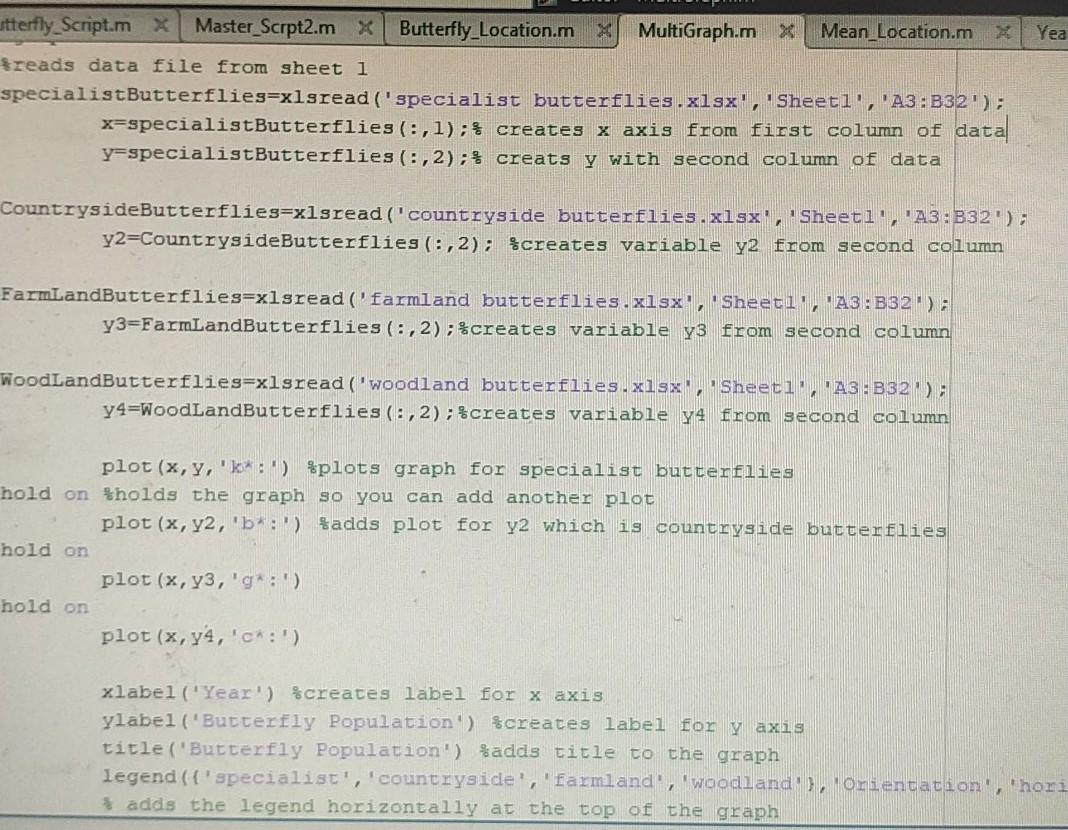
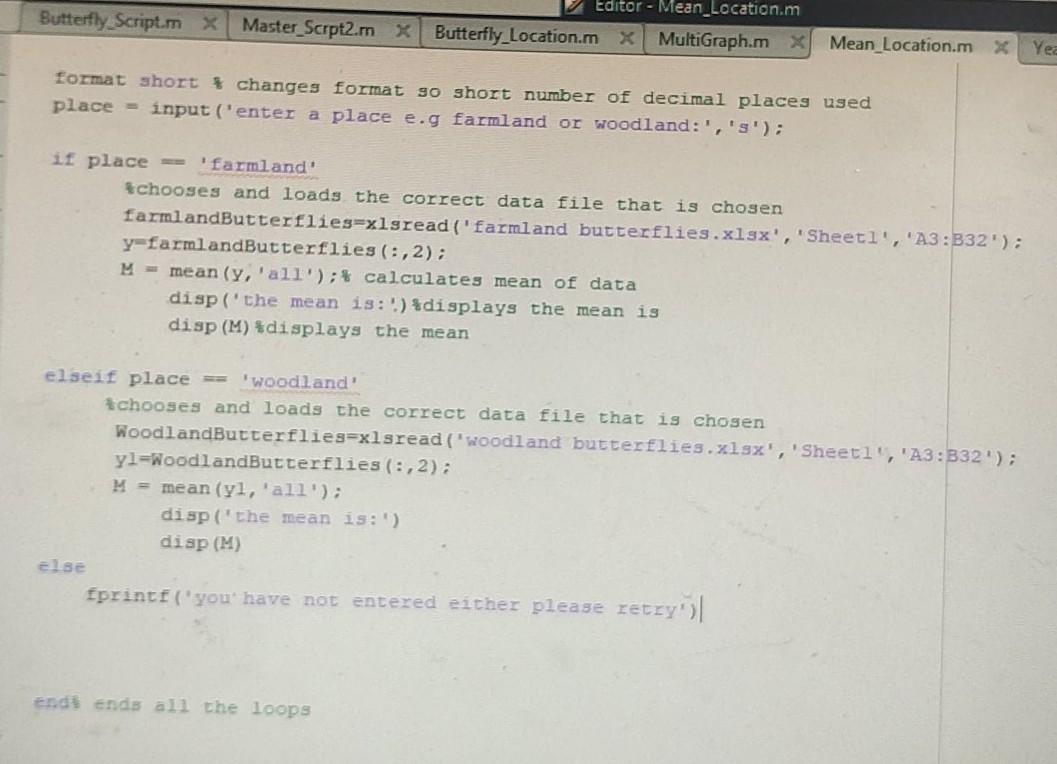
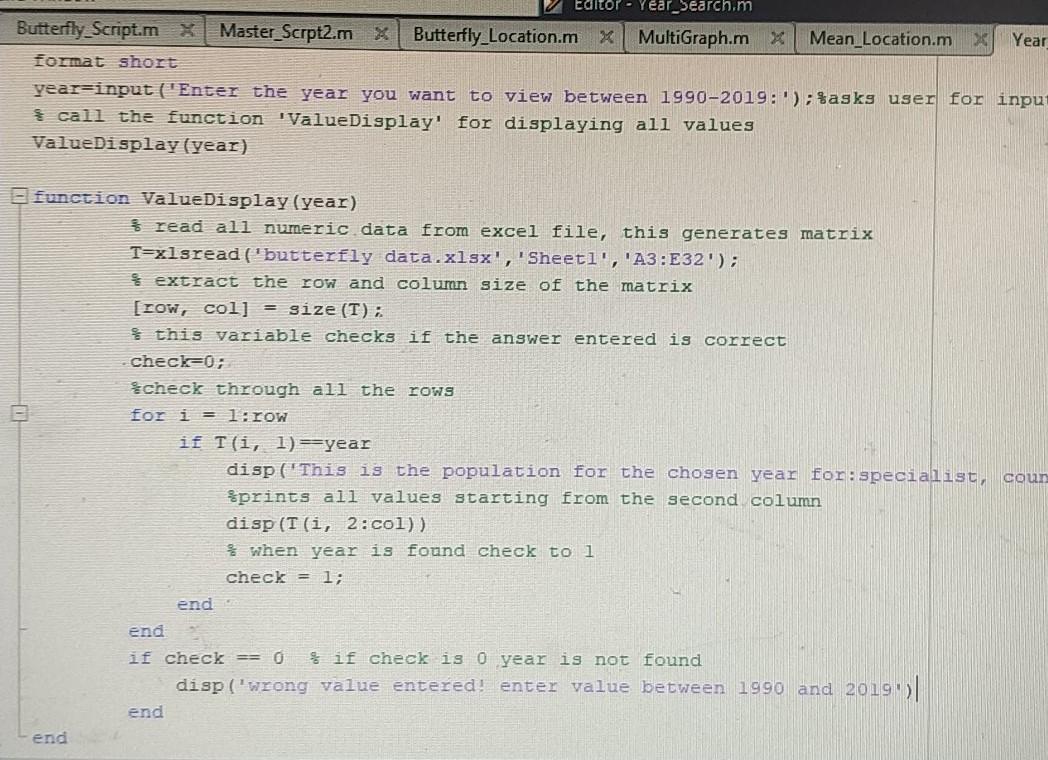
choice = menu ('select place:', 'specialist butterflies', 'countryside butt switch choice case 1% specilist butterflies chose specialistButterflies=xlsread('specialist butterflies.xlsx', 'Sheet x=specialistButterflies (:,1); y-specialistButterflies (:, 2); $ plots a graph for specialist butterflies plot (x, y, 'k*:') xlabel('Year') ylabel ("Butterfly Population') title ("Specialist Butterfly Population') case 2 $countryside butterflies CountrysideButterflies=xlsread('countryside butterflies.xlsx', 'sh x=CountrysideButterflies (:,1); y=CountrysideButterflies (:,2); $ plots a graph plot (x, y, 'b:') xlabel('Year') ylabel ('Butterfly Population') title('Countryside Butterfly Population') case 3 sfarmland butterflies FarmLandButterflies=xlsread ( farmland butterflies.xlsx', 'Sheeti', '1 x=FarmLandButterflies (:,1); y=FarmLandButterflies (: , 2); Yea utterfly_Script.mx Master_Scrpt2.m X Butterfly_Location.m MultiGraph.m X Mean_Location.m X freads data file from sheet i specialistButterflies=xlsread('specialist butterflies .xlsx', Sheeti', 'A3:B32'); x=specialistButterflies (:,1);} creates x axis from first column of data y-specialistButterflies (:, 2); $ creats y with second column of data CountrysideButterflieg=xlsread ('countryside butterflies.xlsx', Sheeti', 'A3:B32'); y2=CountrysideButterflies (:,2); $creates variable y2 from second column FarmLandButterflies=xlsread ('farmland butterflies.xlsx", "Sheeti, A3: B32); y3=FarmLandButterflies (:, 2); creates variable y3 from second column WoodlandButterflies=xlsread('woodland butterflies.xlsx Sheet1 A3 - B32 ) y4=WoodlandButterflies (:, 2); $creates variable 74 from second column plot (x, y, 'k') $plots graph for specialist butterflies hold on tholds the graph so you can add another plot plot (x, y2, 'b':') fadds plot for y2 which is countryside butterflies hold on plot (x, y3,'g :') hold on plot (x, y4,'c:') xlabel('Year') $creates label for x axis ylabel ('Butterfly Population') $creates label for y axis title ('Butterfly Population') %adds title to the graph legend (f 'specialist', 'countryside','farmland', 'woodland), Omientation', 'honi adds the legend horizontally at the top of the graph Butterfly Script.mx Editor - Mean_Location.m Master_Scrpt2.mxButterfly Location.mx MultiGraph.mx Mean_Location.m Yea format short t changes format go short number of decimal places used place = input('enter a place e.g farmland or woodland:',''); if place='farmland Ichooses and loads the correct data file that is chosen farmlandButterflies=xlsread ('farmland butterflies.xlsx', 'Sheetl', 'A3:B32'); y=farmlandButterflies (:,2); M = mean (y'all'); calculates mean of data disp('the mean is:') *displays the mean is disp (M) *displays the mean elseif place = 'woodland' chooses and loads the correct data file that is chosen WoodlandButterflies=xlsread ('woodland butterflies.xlsx', 'Sheetl', 'A3:332'); yl-NoodlandButterflies (:,2); M = mean (yl, 'all'); disp('the mean is:') disp (M) else fprintf ("you have not entered either please retry | end ends all the loops Year_Search.m Butterfly Script.mx Master_Scrpt2.m X Butterfly Location.m X MultiGraph.m X Mean_Location.mx Year Format short year=input ("Enter the year you want to view between 1990-2019: '); $asks user for input * call the function 'ValueDisplay' for displaying all values ValueDisplay (year) function ValueDisplay (year) 3 read all numeric data from excel file, this generates matrix T=xlsread ('butterfly data.xlsx', 'Sheetl', 'A3:E32'); extract the row and column size of the matrix [row, col] = size (T): this variable checks if the answer entered is correct check=0; check through all the rows for i = 1:row if T'i, 1) =year disp('This is the population for the chosen year for specialist, coun prints all values starting from the second column disp (T(i, 2:col)) when year is found check to 1 check = 1; end end if check == 0 if check is 0 year is not found disp('wrong value entered! enter value between 1990 and 2019')| end end
Step by Step Solution
There are 3 Steps involved in it

Get step-by-step solutions from verified subject matter experts