

Question: where Y = Production rating and X = Test score. b. If a worker's test score was 43, what would be your forecast of the
where Y = Production rating and X = Test score.
b. If a worker's test score was 43, what would be your forecast of the worker's production rating? 49". (Enter your response as an integer.)
c. Comment on the strength of the relationship between the test scores and production ratings.
The coefficient of correlation for the least-squares regression model is 0.937 and the coefficient of determination is 0.878 (Enter your responses rounded to three decimal places.)
There is a strong positive relationship. The regression equation explains 88 % of variation in ratings. (Enter your response as an integer.)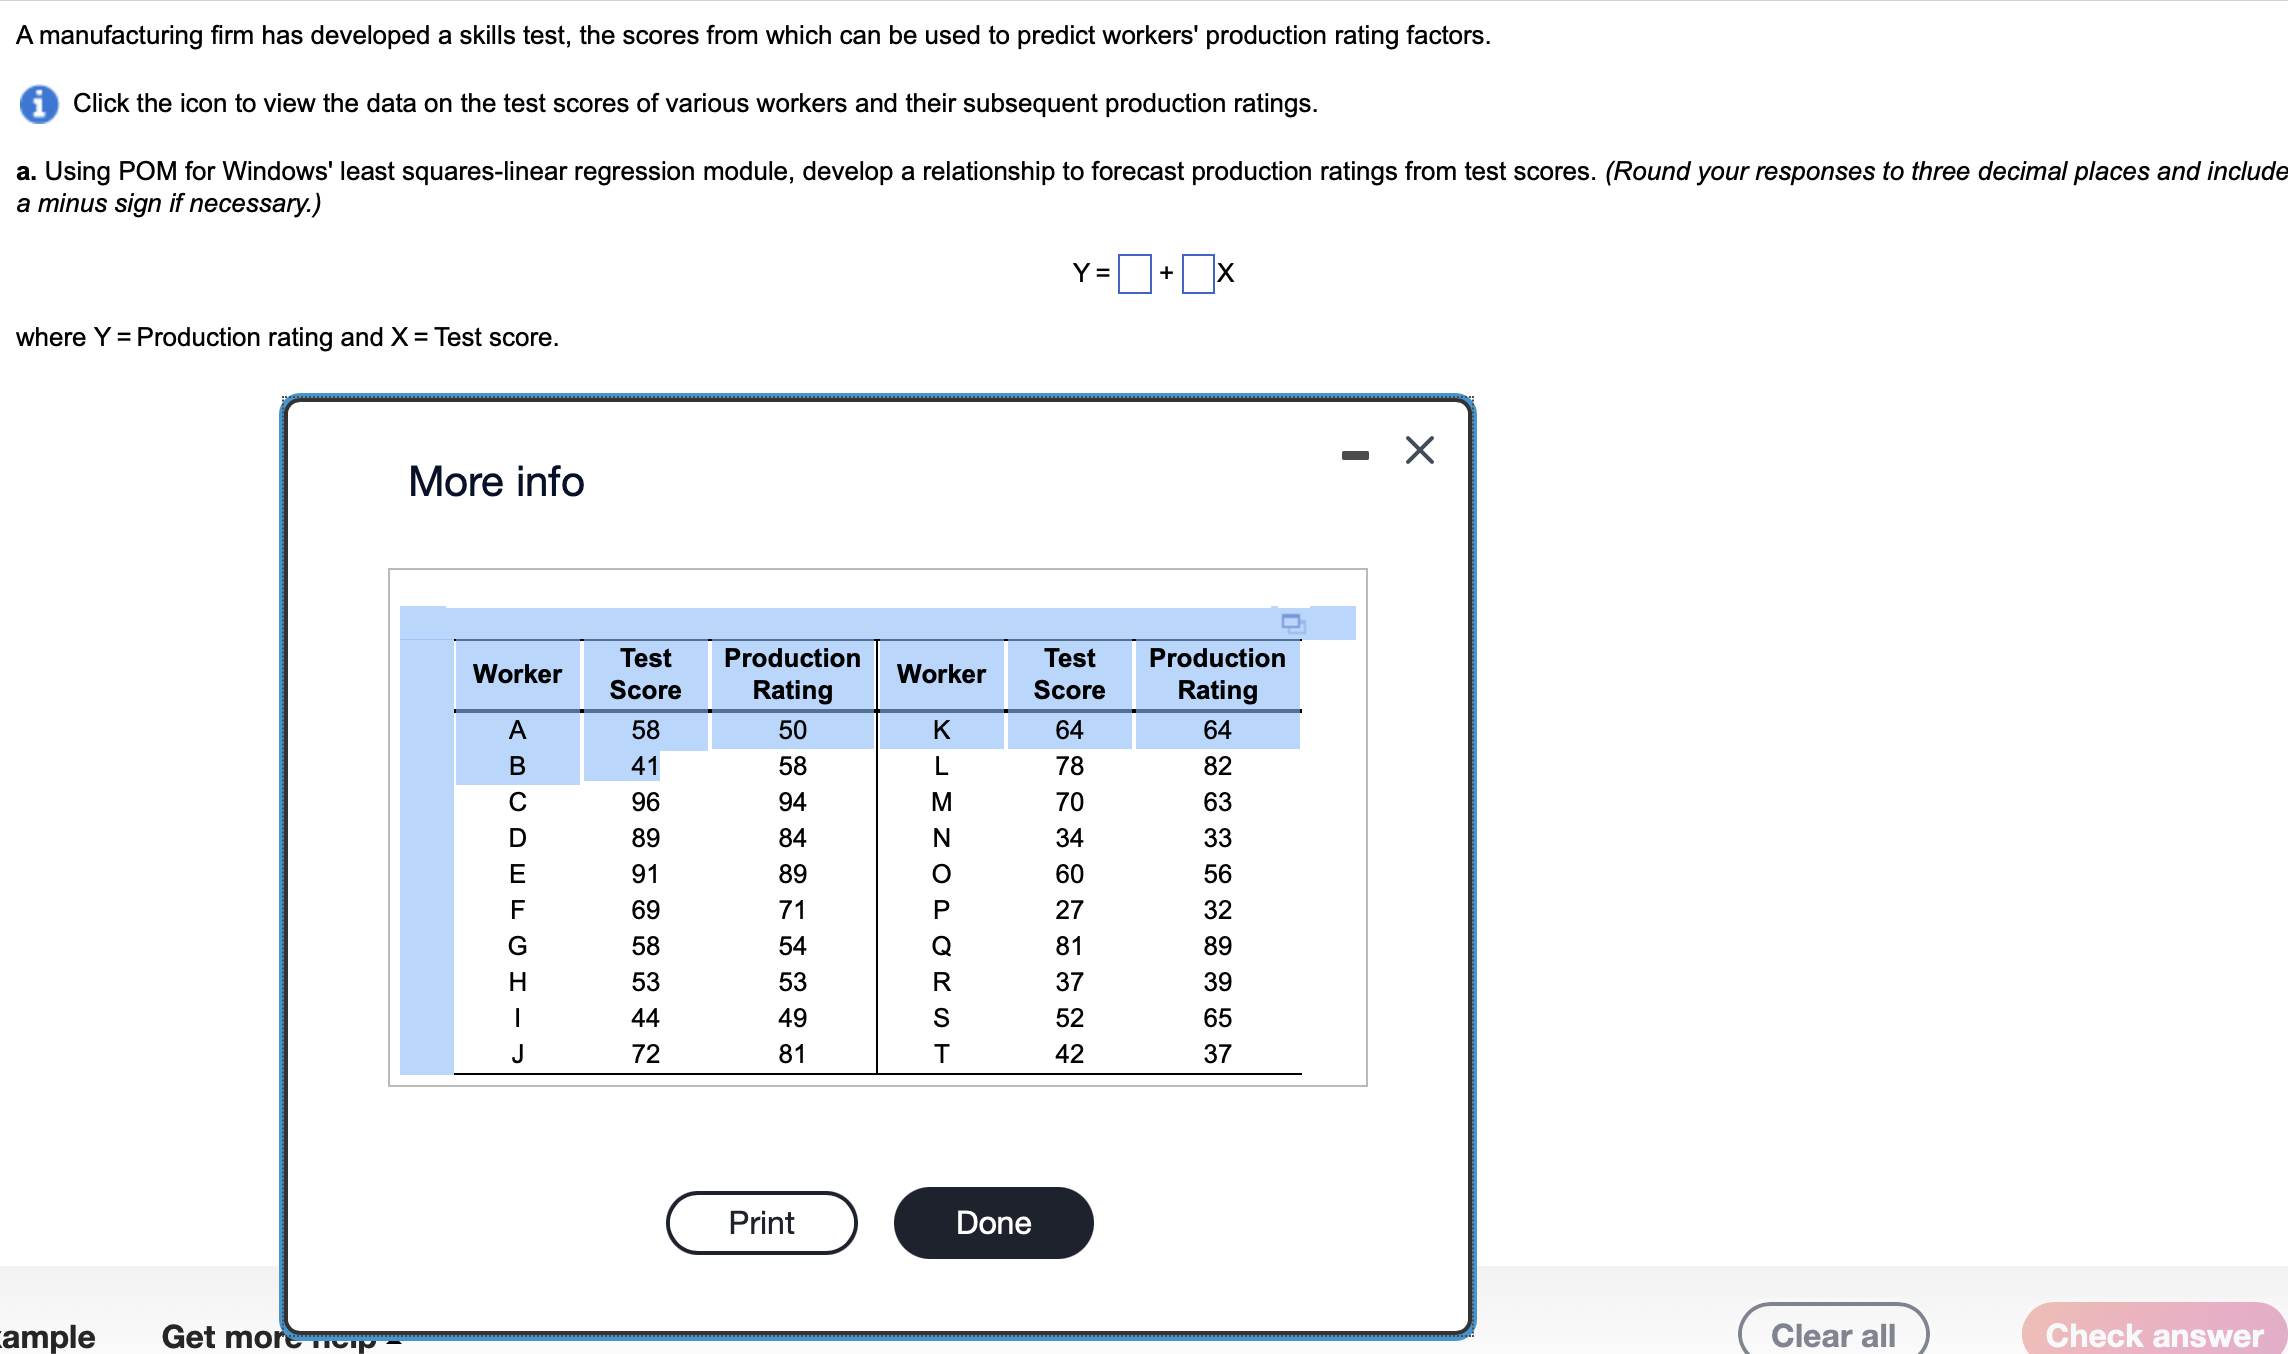
A manufacturing firm has developed a skills test, the scores from which can be used to predict workers' production rating factors. Click the icon to view the data on the test scores of various workers and their subsequent production ratings. a. Using POM for Windows' least squares-linear regression module, develop a relationship to forecast production ratings from test scores. (Round your responses to three decimal places and includ a minus sign if necessary.) Y=+x where Y= Production rating and X= Test score. More info
Step by Step Solution
There are 3 Steps involved in it

Get step-by-step solutions from verified subject matter experts