

Question: WHICH ANSWER IS CORRECT I AM NOT SURE???!!! CAN SOMEONE HELP ME? Figure 7.1 i With respect to the graph above (PBEHP. 12 Ed, page
WHICH ANSWER IS CORRECT I AM NOT SURE???!!! CAN SOMEONE HELP ME?
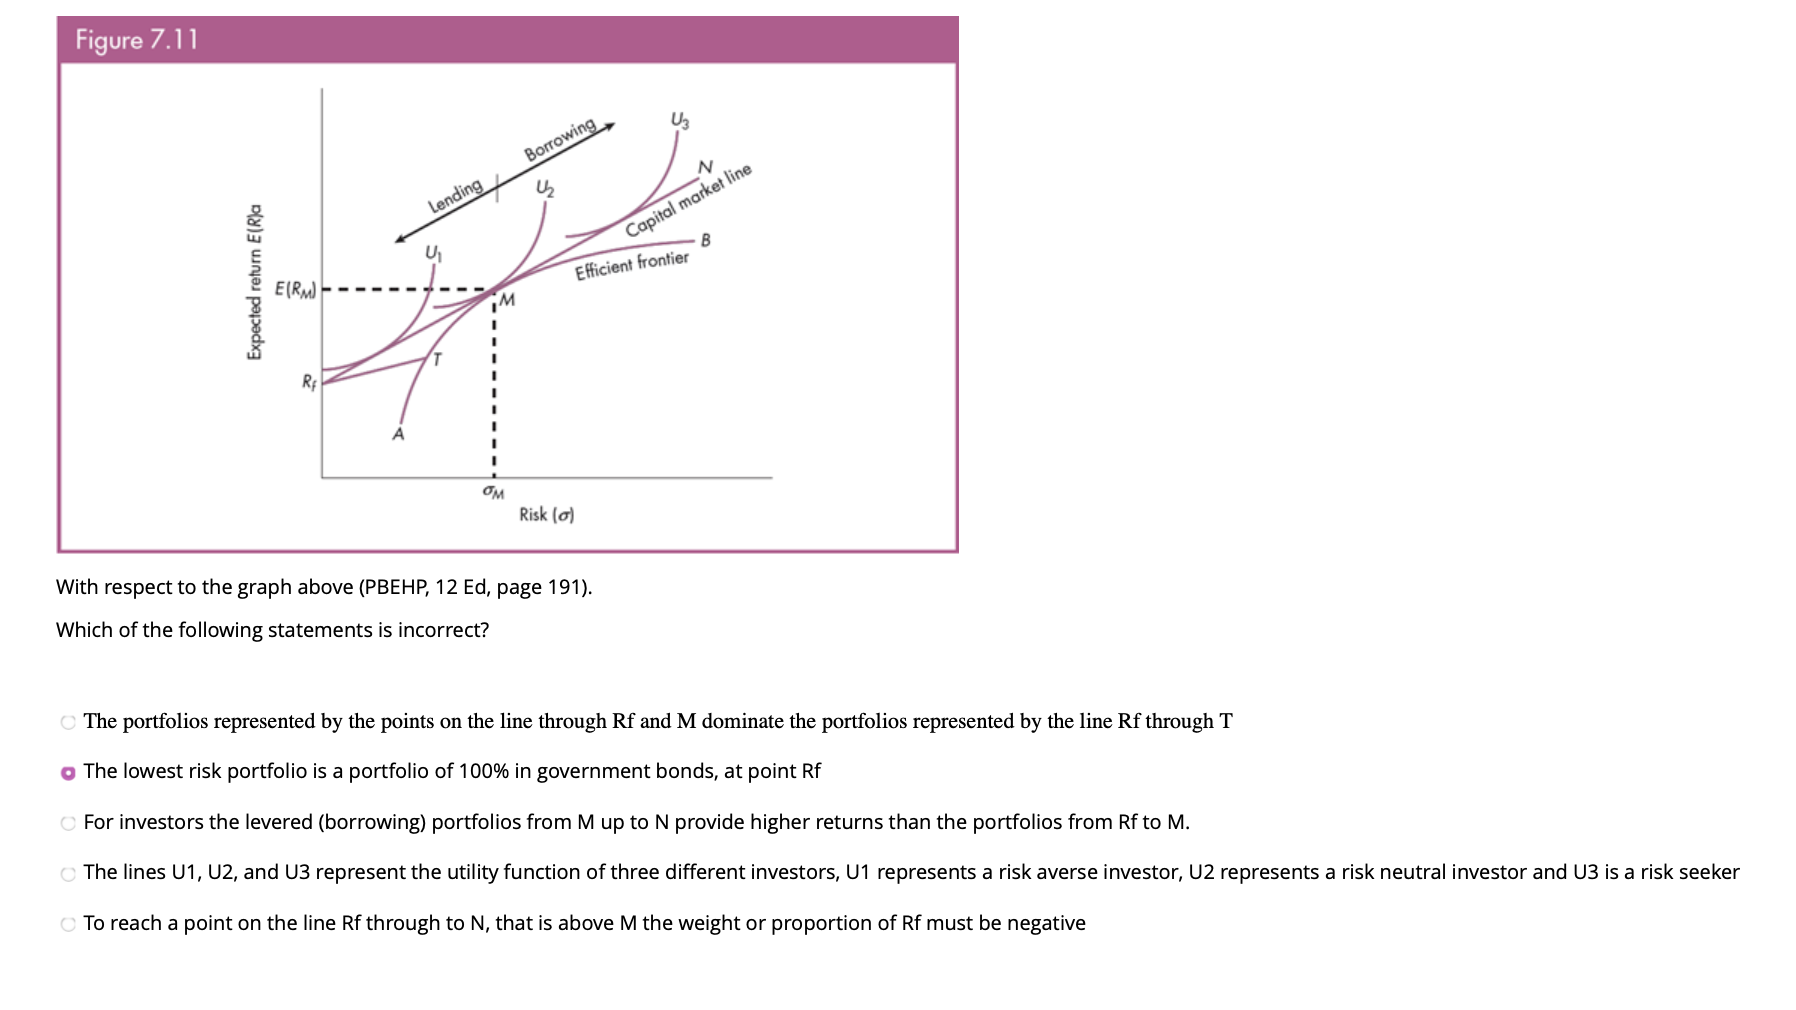
Figure 7.1 i With respect to the graph above (PBEHP. 12 Ed, page 191). Which of the following statements is incorrect? The portfolios represented by the points on the line through Rf and M dominate the portfolios represented by the line thhrough T g The lowest risk portfolio is a portfolio of 100% in government bonds, at point Rf For investors the levered (borrowing) portfolios from M up to N provide higher returns than the portfolios from Rf to M. The lines U1, U2, and U3 represent the utility function of three different investors, U1 represents a risk averse investor, U2 represents a risk neutral investor and U3 is a risk seeker To reach a point on the line Rf through to N, that is above M the weight or proportion of Rf must be negative
Step by Step Solution
There are 3 Steps involved in it

Get step-by-step solutions from verified subject matter experts