

Question: Which aspect of graphs make you assume that lottery numbers are drawn at random meaning that each possible number combination is equally likely to be
Which aspect of graphs make you assume that lottery numbers are drawn at random meaning that each possible number combination is equally likely to be drawn?
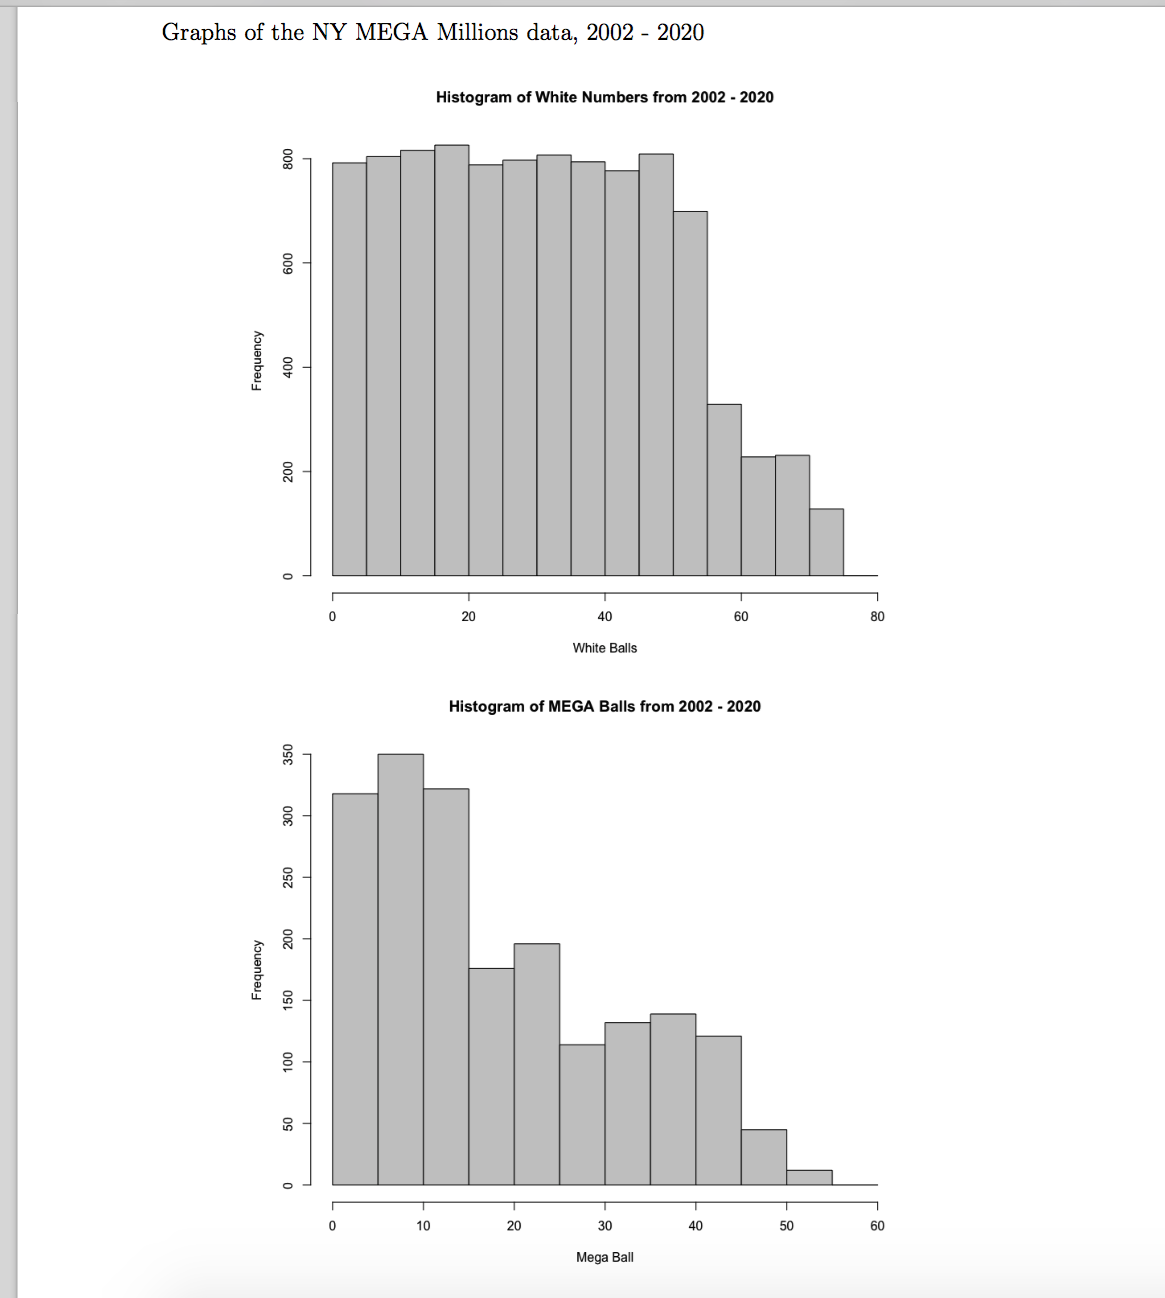
Graphs of the NY MEGA Millions data, 2002 - 2020 Histogram of White Numbers from 2002 - 2020 800 600 Frequency 400 200 20 40 60 80 White Balls Histogram of MEGA Balls from 2002 - 2020 350 300 250 200 Frequency 150 100 50 10 20 30 40 50 60 Mega Ball
Step by Step Solution
There are 3 Steps involved in it
1 Expert Approved Answer
Step: 1 Unlock

Question Has Been Solved by an Expert!
Get step-by-step solutions from verified subject matter experts
Step: 2 Unlock
Step: 3 Unlock