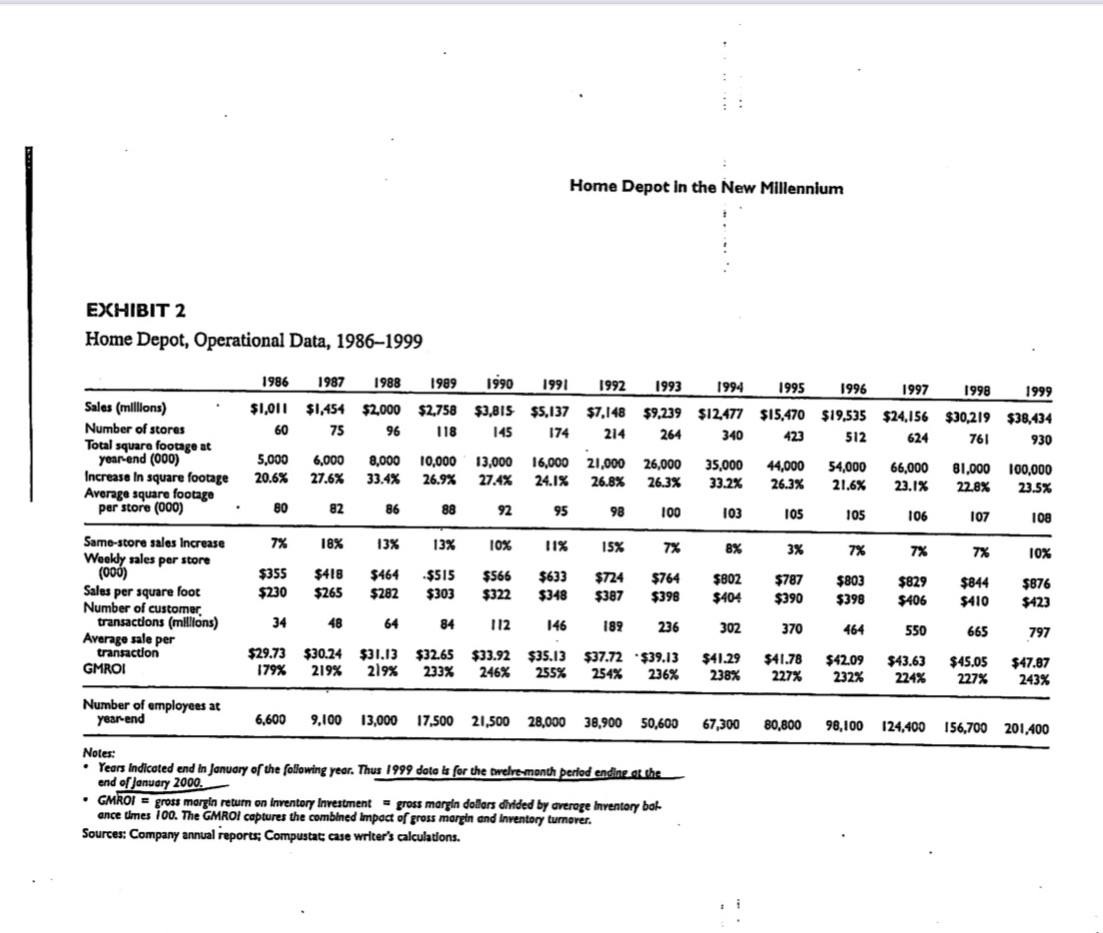
Question: Which chain do you think is most PRODUCTIVE, given the square footage information? Refer to Exhibit 2 (page 8-32 of the New Millenium case) for

Which chain do you think is most PRODUCTIVE, given the square footage information? Refer to Exhibit 2 (page 8-32 of the "New Millenium" case) for the type of information you might want to look at for the most recent years to evaluate productivity per square foot. Explain and support your answer

Which chain do you think is most PRODUCTIVE,
Home Depot in the New Millennium EXHIBIT 2 Home Depot, Operational Data, 1986-1999 1986 1987 1988 1989 1990 1661 1992 1993 1994 1995 1996 1997 1998 1999 Sales (millions) $1,011 $1,454 $2,000 $2,758 $3,815 $5,137 $7.148 $9.239 $12,477 $15,470 $19,535 $24,156 $30,219 $38,434 Number of stores 75 96 118 145 174 214 264 340 423 512 624 761 930 Total square footage at year-end (000) 5.000 6.000 8,000 10,000 13,000 16,000 21,000 26,000 35,000 44,000 54,000 66,000 81.000 100,000 Increase In square footage 20.6% 27.6% 33.4% 26.9% 27.4% 24.1% 26.8% 26.3% 33.2% 26.3% 21.6% 23.1% 22.8% 23.5% Average square footage per store (000) 82 97 95 98 100 103 105 105 106 107 108 Same-store sales Increase 7% 18% 13% 13% 10% 11% 15% 7% 8% 3% 7% 7% 7% 10% Weekly sales per store (000) $355 $418 $464 $515 $566 $633 $724 $764 $802 $787 $803 $829 $844 $876 Sales per square foot $230 $265 $282 $303 $322 $348 $387 $398 $404 $390 $398 $406 $410 $423 Number of customer transactions (millions) 34 64 84 112 146 189 236 302 370 464 550 665 797 Average sale per transaction $29.73 $30.24 $31.13 $32.65 $33.92 $35.13 $37.72 .$39.13 $41.29 $41.78 $42.09 $43.63 $45.05 $47.87 GMROI 179% 219% 219% 233% 246% 255% 254% 236% 238% 227% 232% 224% 227% 243% Number of employees at 98,100 124,400 156,700 201.400 year-end 6.600 9,100 13,000 17,500 21,500 28,000 38,900 50,600 67,300 80,800 Notes: Years Indicated end in January of the following year. Thus 1999 data is for the two month period ending at the end of January 2000. GMROI = gross margin return on inventory Investment = gross margin dollars divided by average Inventory bak- ance times 100. The GMROI captures the combined Impact of gross margin and Inventory turnover. Sources: Company annual reports; Compustat: case writer's calculations

Step by Step Solution

There are 3 Steps involved in it

1 Expert Approved Answer
Step: 1 Unlock blur-text-image
Question Has Been Solved by an Expert!

Get step-by-step solutions from verified subject matter experts

Step: 2 Unlock
Step: 3 Unlock

Students Have Also Explored These Related Accounting Questions!