

Question: Which command will create a plot of acceleration vs. time (i.e, a vector time on the x-axis and a vector acceleration on the y-axis)? I.
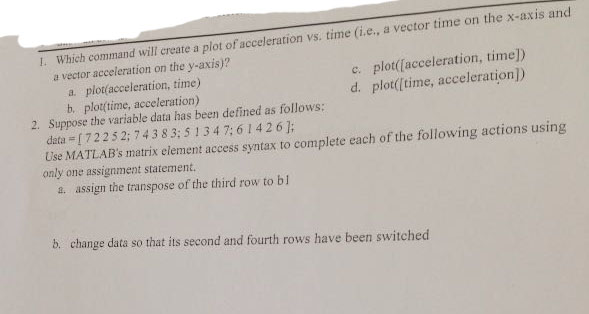
Which command will create a plot of acceleration vs. time (i.e, a vector time on the x-axis and a vector acceleration on the y-axis)? I. c. plot(acceleration, time]) d. plot(time, acceleration) a. plot(acceleration, time) b. plottime, acceleration) Suppose the variable data has been defined as follows: data [72252;74383:5 1347:61426; Use MATLABs matrix element access syntax to complete each of the following actions using 2. only one assignment statement. assign the transpose of the third row to bi a. b. change data so that its second and fourth rows have been switched
Step by Step Solution
There are 3 Steps involved in it
1 Expert Approved Answer
Step: 1 Unlock

Question Has Been Solved by an Expert!
Get step-by-step solutions from verified subject matter experts
Step: 2 Unlock
Step: 3 Unlock