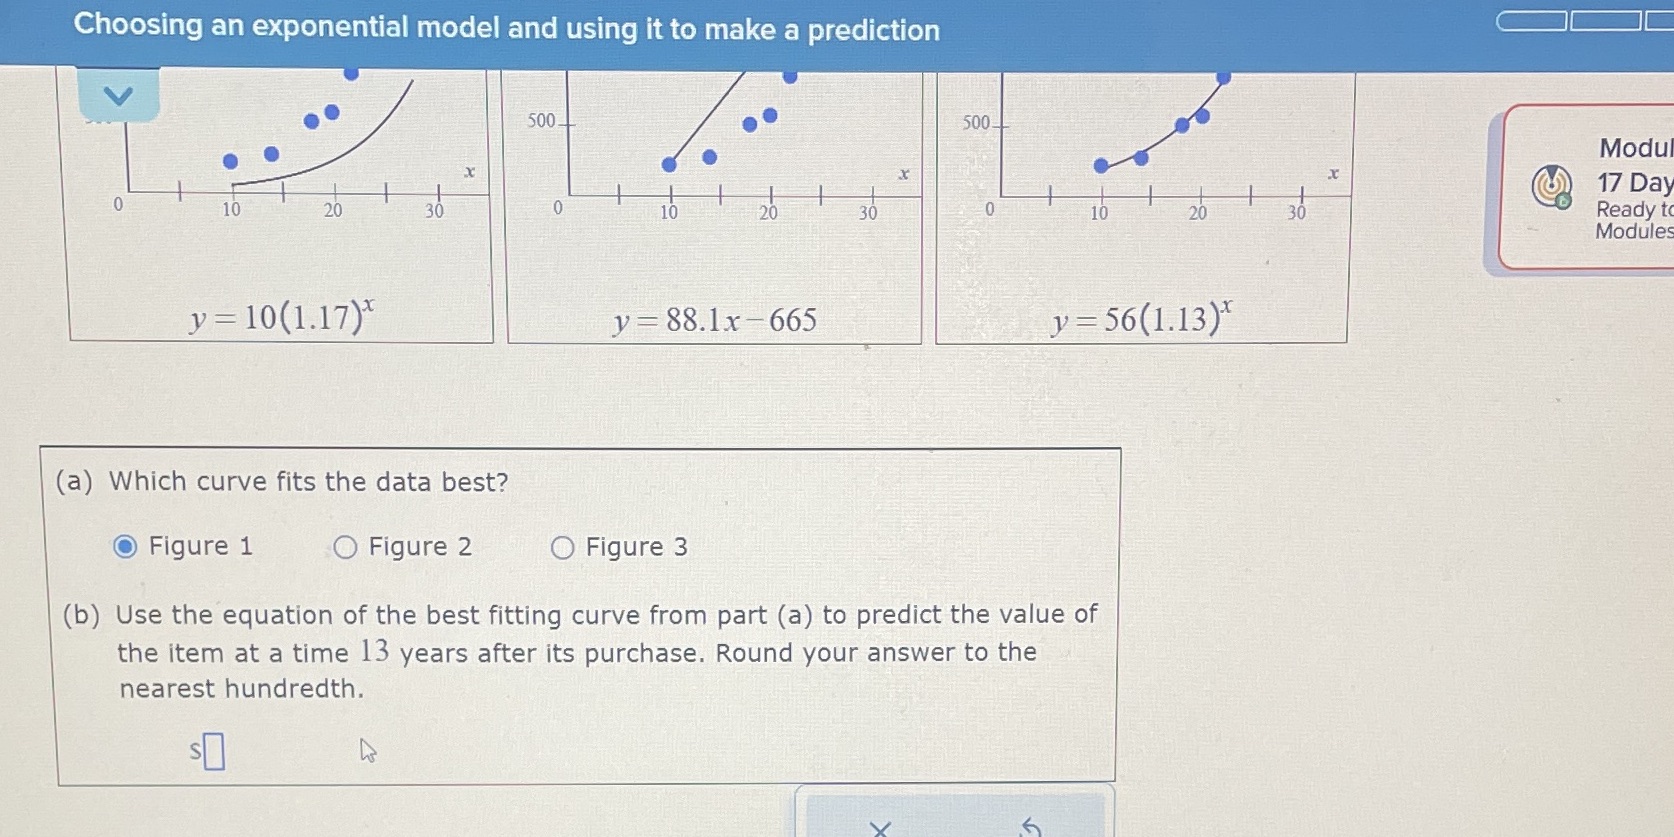
Question: Which figure is it and how much is the value? Choosing an exponential model and using it to make a prediction 500 500 Modul X

Which figure is it and how much is the value?

Which figure is it and how much is the value?
Choosing an exponential model and using it to make a prediction 500 500 Modul X 17 Day 10 20 30 30 10 20 30 Ready to Modules y = 10(1.17) y = 88.1x -665 y = 56(1.13)* (a) Which curve fits the data best? Figure 1 O Figure 2 O Figure 3 (b) Use the equation of the best fitting curve from part (a) to predict the value of the item at a time 13 years after its purchase. Round your answer to the nearest hundredth

Step by Step Solution

There are 3 Steps involved in it

1 Expert Approved Answer
Step: 1 Unlock blur-text-image
Question Has Been Solved by an Expert!

Get step-by-step solutions from verified subject matter experts

Step: 2 Unlock
Step: 3 Unlock

Students Have Also Explored These Related Mathematics Questions!