

Question: - Which forecasting method would you finally select for producing forecasts? Explain. Stage 8: Quantifying Forecasted Loss in Tourism Revenue (10%) - Using all the
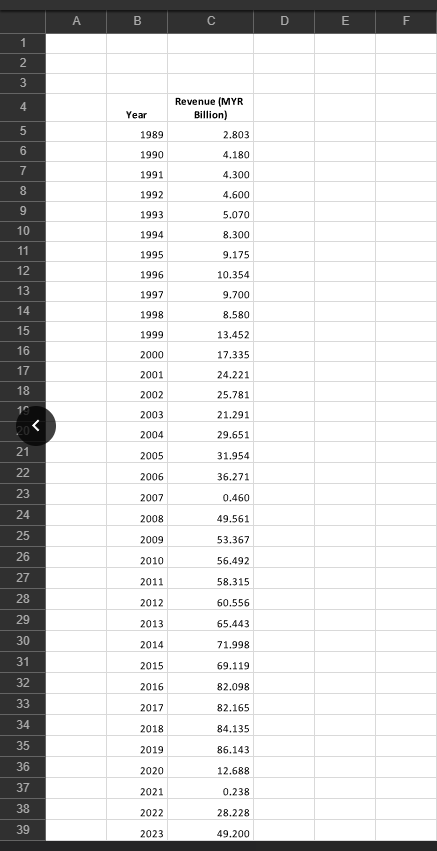
- Which forecasting method would you finally select for producing forecasts? Explain. Stage 8: Quantifying Forecasted Loss in Tourism Revenue (10\%) - Using all the results obtained thus far, calculate the average forecasted loss in tourism revenue (in RM billion) sustained by Malaysia since the start of the pandemic. - calculate a range of forecasted loss in tourism revenue. (Note: This is a higher-order thinking question). - Conclude the assignment with some recommended policies. Stage 5: Partition Series (5\%) - First, using your full dataset defined from Stage 4, partition your series into 2 parts labelled as "Pre-Covid" and "Covid". Ensure that the "Covid" part comprises data that coincides with the time frame when Malaysia was affected by the pandemic. - The "Pre-Covid" part comprises data prior to the start of the pandemic in Malaysia. - Next, divide the "Pre-Covid" dataset into a training set and test set. Be sure to state the time periods over which your training and test sets span, respectively. Also, report the number of observations in each of these sets. Stage 6: Apply Forecasting Methods/Models (30\%) - Using appropriate tools and methods, identify One of the 4 simple forecasting methods from Topic 3 to fit the training set data. Justify your answers. - Using the training set data, fit your identified forecasting models from above, and also use the ets() function in R to automatically select an ETS model. Report the ETS model selected by R. - Ensure that your plots are correctly labelled. Comment on the plots. - Perform residual diagnostic checks for all the methods. - Which of the above methods has the best goodness of fit? Explain if this is what you expected. - Use each of the above methods to produce forecasts for the test set period. Subsequently, plot the "Pre-Covid" data set (i.e. both training and test set data), along with the forecasts produced by the forecasting methods. Do not include prediction intervals in the plot. Make sure that your axes are labeled correctly, along with the chart title. Make sure that you insert a legend in the plot, correctly labeling the various forecasts. - Describe the forecast plots in detail, giving explanations as to why the test set forecasts produced by the above methods look as such. Stage 7: Evaluate \& Compare Forecasting Performance (30\%) - Evaluate the out-of-sample forecast accuracy of the forecasting methods using the traditional approach. Be sure to articulate the process of how you did this evaluation. Which method forecasts best? - Evaluate the forecasting performance using time series cross-validation with a forecast horizon of h=12. Do you come to the same conclusion? Assignment Aim: To quantify the forecasted financial loss in Malaysian tourism revenue (RM billion) since the Covid-19 pandemic. Instructions: Proceed with the prescribed Forecasting Process below, write a research report based on your analysis. Your report should include tables and graphs and associated narratives. Keep the report concise and clear. Thoughtfulness, clarity of your discussion and the communication of your results are important. Stage 1: Define Goal (10\%) - Referring to appropriate academicews article citations, provide a brief background of the tourism sector in Malaysia and a subsequent narration of how COVID-19 has impacted tourism in Malaysia. - In relation to the Assignment Aim above, define the goal of the forecasting problem you are going to address in this report. - Students should write no more than 1 page for this Stage. Stage 2: Get Data (2\%) - You will obtain data on tourism revenue and tourist arrivals to Malaysia. - Download datasets ranging from January 1989 to June 2023. - Import the data into RStudio to begin your analysis, doing the needful to convert it into a time-series object. - For the purpose of completeness of presentation, you can just briefly write a sentence stating where the data was obtained from. Stage 3: Explore and Visualize Series (10\%) - Plot suitable time series graphics. Be selective on the number and type of graphs you want to display. - Describe in detail your time series graphics. Identify any patterns or outliers. If applicable, explain events that caused data plots that display a sudden jump or drop. Stage 4: Pre-Process Data (3\%) - Based on data visualization, determine the choice of your time span. You can decide on the start date of your dataset for this assignment. In other words, you can use the full data set from Jan 1989 to Mar 2023, or you may exclude a portion of the data, in which the start date can be set later than Jan 1989. Be sure to justify your answer. - Note that the end date must be March 2023. \begin{tabular}{|c|c|c|c|c|c|c|} \hline & A & B & C & D & E & F \\ \hline 1 & & & & & & \\ \hline 2 & & & & & & \\ \hline 3 & & & & & & \\ \hline 4 & & Year & \begin{tabular}{l} Revenue (MYR \\ Billion) \end{tabular} & & & \\ \hline 5 & & 1989 & 2.803 & & & \\ \hline 6 & & 1990 & 4.180 & & & \\ \hline 7 & & 1991 & 4.300 & & & \\ \hline 8 & & 1992 & 4.600 & & & \\ \hline 9 & & 1993 & 5.070 & & & \\ \hline 10 & & 1994 & 8.300 & & & \\ \hline 11 & & 1995 & 9.175 & & & \\ \hline 12 & & 1996 & 10.354 & & & \\ \hline 13 & & 1997 & 9.700 & & & \\ \hline 14 & & 1998 & 8.580 & & & \\ \hline 15 & & 1999 & 13.452 & & & \\ \hline 16 & & 2000 & 17.335 & & & \\ \hline 17 & & 2001 & 24.221 & & & \\ \hline 18 & & 2002 & 25.781 & & & \\ \hline 18 & & 2003 & 21.291 & & & \\ \hline 20
Step by Step Solution
There are 3 Steps involved in it

Get step-by-step solutions from verified subject matter experts