

Question: Which graph best represents patterns of risk and return for all possible combinations of two risky stocks in a portfolio? The two stocks are represented
Which graph best represents patterns of risk and return for all possible combinations of two risky stocks in a portfolio? The two stocks are represented by A and B and their returns are not perfectly correlated.
-
A
-
B
-
C
-
D
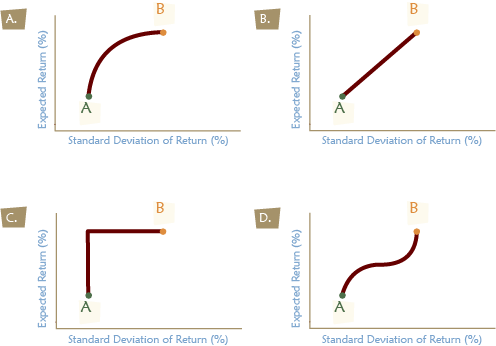
B B B. Expected Return (%) Expected Return (%) Standard Deviation of Return (%) Standard Deviation of Return (%) B B C. D. Expected Return (%) Expected Return (%) A Standard Deviation of Return (%) Standard Deviation of Return (%)
Step by Step Solution
There are 3 Steps involved in it
1 Expert Approved Answer
Step: 1 Unlock

Question Has Been Solved by an Expert!
Get step-by-step solutions from verified subject matter experts
Step: 2 Unlock
Step: 3 Unlock