

Question: Which graph display the correct data applied in the graphs below? The frequency table below categorizes winners of a prize in literature by their age
Which graph display the correct data applied in the graphs below?
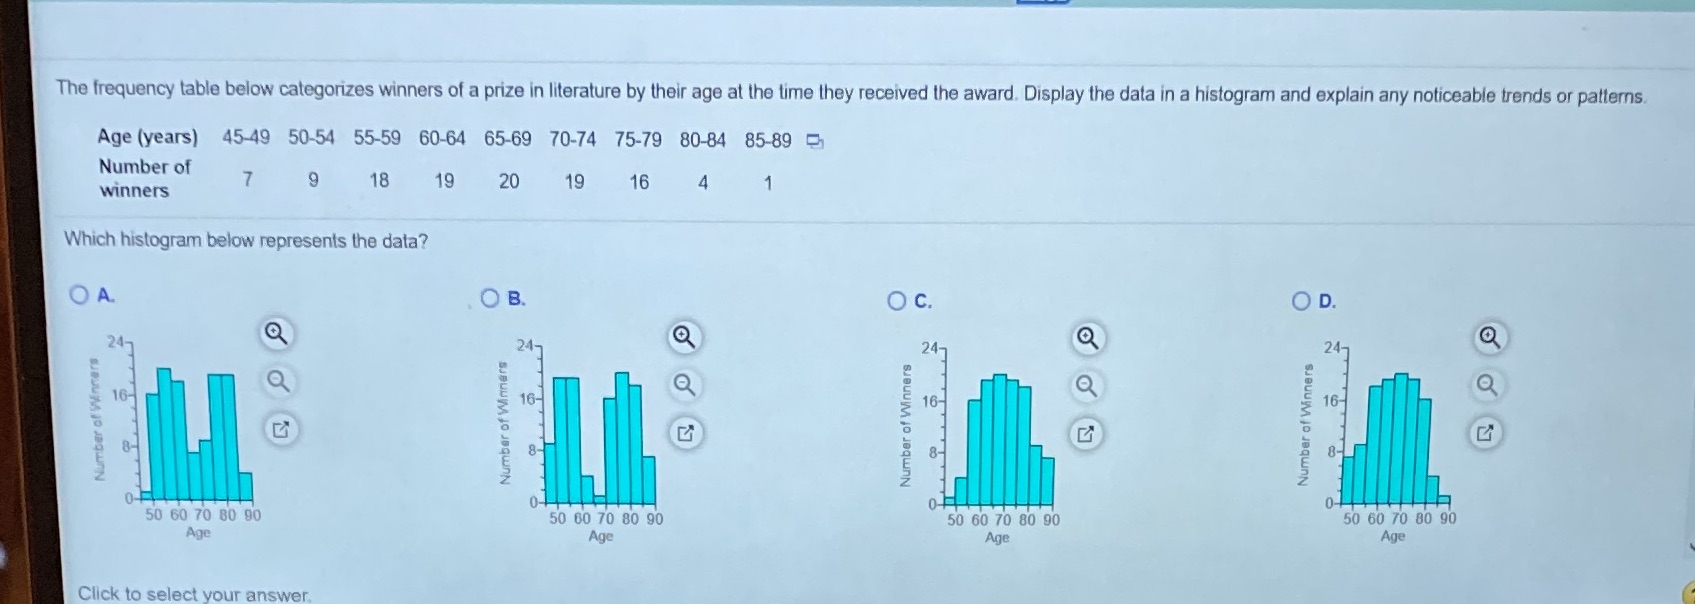
The frequency table below categorizes winners of a prize in literature by their age at the time they received the award. Display the data in a histogram and explain any noticeable trends or patterns. Age (years) 45-49 50-54 55-59 60-64 65-69 70-74 75-79 80-84 85-89 Number of 7 9 18 19 20 19 16 4 winners Which histogram below represents the data? O A. O B O C. OD. 247 247 24- 247 Q 16- 16- 16- 16- Number of Winners Number of Winners Number of Winners Number of Winners 8- B - O- 50 60 70 80 90 50 60 70 80 90 50 60 70 80 90 50 60 70 80 90 Age Age Age Age Click to select your
Step by Step Solution
There are 3 Steps involved in it

Get step-by-step solutions from verified subject matter experts