

Question: which graph represents the function? - 1. Which graph represents the function f(x) = -4 A. x-9 C. B. -20 -16 -12-8 -20 -16 -12
which graph represents the function?
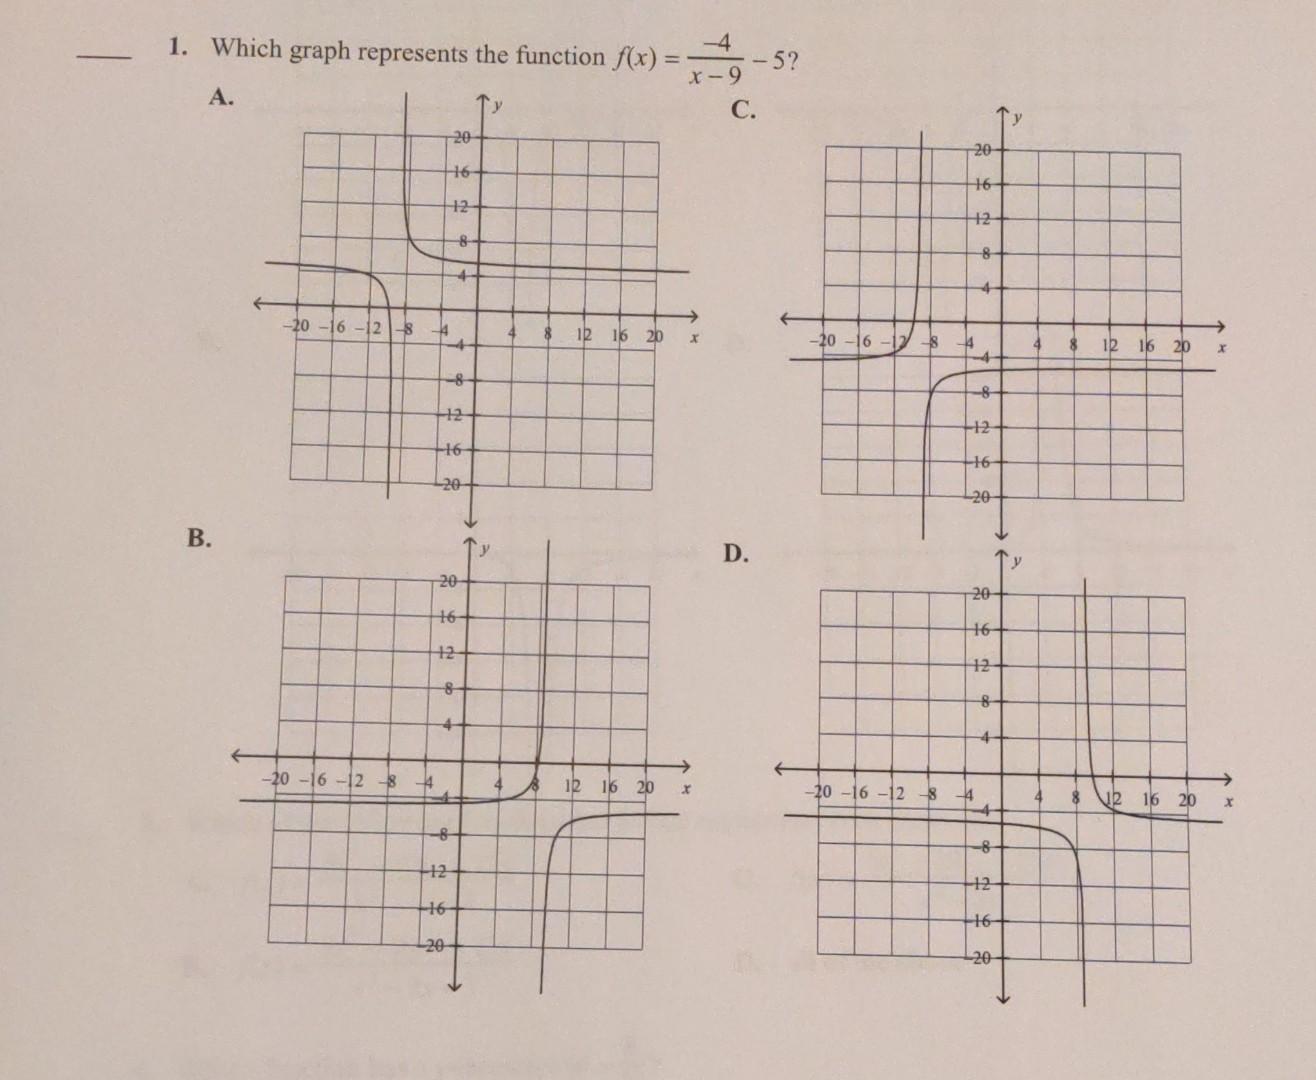
- 1. Which graph represents the function f(x) = -4 A. x-9 C. B. -20 -16 -12-8 -20 -16 -12 -8 -44 -14 20 16- 12 20 12 8 -8 12 +16+ 20 4 20 46- 12 -8- -4- -16- 2 y 4 $ 12 16 20 x 12 16 20 x D. - 5? 20 16- 12- -20 -16 -12 84 8 + -4 -8 12 +16- 20- -20 -16 -12 8 4 20 16- 42 8 +4 -8 12 16- 20 4 4 $ 12 16 20 x 8 12 16 20 X
Step by Step Solution
There are 3 Steps involved in it
1 Expert Approved Answer
Step: 1 Unlock

The detailed answer for the above question is provided below The graph that represents the function ... View full answer
Question Has Been Solved by an Expert!
Get step-by-step solutions from verified subject matter experts
Step: 2 Unlock
Step: 3 Unlock