

Question: Which graphs represent an object that is slowing down? A. 2 and3 B. 2 and 4 C. 1 and 4 D. 1 and 2 E.
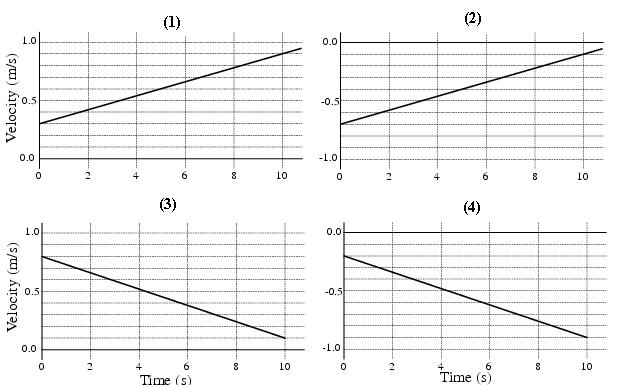
Which graphs represent an object that is slowing down? A. 2 and3 B. 2 and 4 C. 1 and 4 D. 1 and 2 E. 1 and 3 F. 3 and 4
1.0 Velocity (m/s) Velocity (m/s) 0.0 0 1.0 0.5 0.0 0 2 2 4 (1) (3) 6 Time (s) 00 8 8 00 10 10 0.0 -0.5 -1.0 0 0.0 -0.5 -1.0 0 C 2 (2) 6 Time (s) 8 8 00 OT 10
Step by Step Solution
★★★★★
3.50 Rating (150 Votes )
There are 3 Steps involved in it
1 Expert Approved Answer
Step: 1 Unlock

The detailed answer for the above question is provided ... View full answer
Question Has Been Solved by an Expert!
Get step-by-step solutions from verified subject matter experts
Step: 2 Unlock
Step: 3 Unlock