

Question: Which histogram below shows a data set that is skewed right Frequency Frequency 87654321 Frequency 54427765 1 1 2 3 4 5 6 7 8

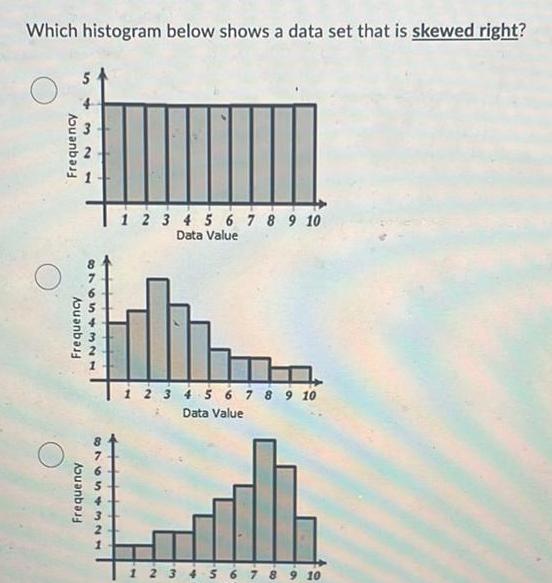
Which histogram below shows a data set that is skewed right Frequency Frequency 87654321 Frequency 54427765 1 1 2 3 4 5 6 7 8 9 10 Data Value 1 2 3 4 5 6 7 8 9 10 Data Value 1 2 3 4 5 6 7 8 9 10
Step by Step Solution
There are 3 Steps involved in it
1 Expert Approved Answer
Step: 1 Unlock

Question Has Been Solved by an Expert!
Get step-by-step solutions from verified subject matter experts
Step: 2 Unlock
Step: 3 Unlock