

Question: Which histogram depicts a higher standard deviation? 10- 8- Frequency 6 0 30 40 50 60 (a) 70 70 G Frequency 08642. 0- 40
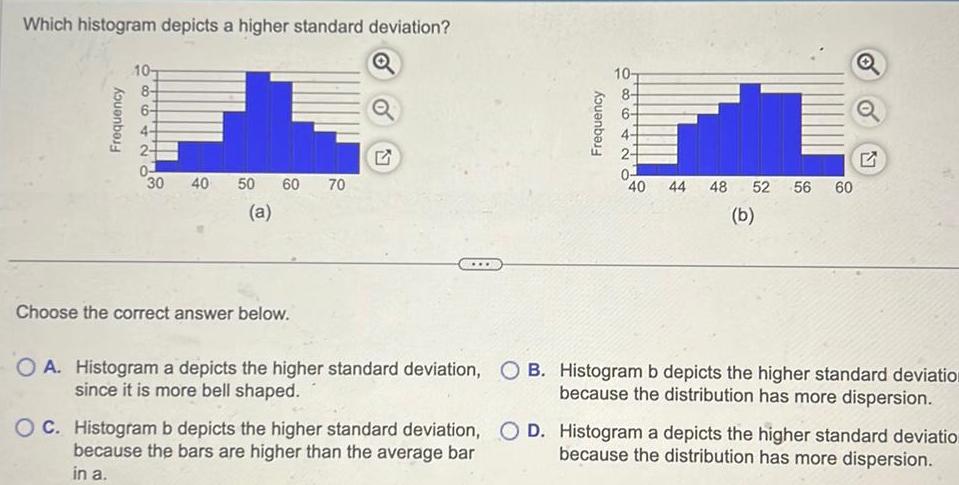
Which histogram depicts a higher standard deviation? 10- 8- Frequency 6 0 30 40 50 60 (a) 70 70 G Frequency 08642. 0- 40 44 44 48 52 56 60 (b) Choose the correct answer below. OA. Histogram a depicts the higher standard deviation, B. Histogram b depicts the higher standard deviation since it is more bell shaped. OC. Histogram b depicts the higher standard deviation, because the bars are higher than the average bar in a. because the distribution has more dispersion. D. Histogram a depicts the higher standard deviatio because the distribution has more dispersion.
Step by Step Solution
There are 3 Steps involved in it
1 Expert Approved Answer
Step: 1 Unlock

Question Has Been Solved by an Expert!
Get step-by-step solutions from verified subject matter experts
Step: 2 Unlock
Step: 3 Unlock