

Question: which is the more appropriate answer for this question? To keep track of air quality, which of the following graphical displays is more appropriate for
which is the more appropriate answer for this question?
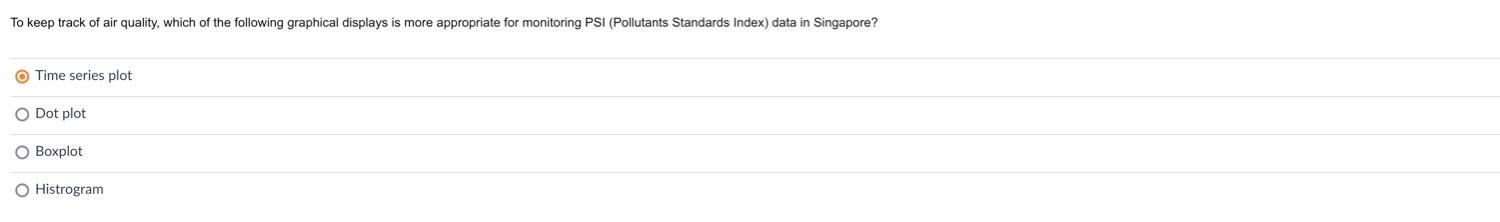
To keep track of air quality, which of the following graphical displays is more appropriate for monitoring PSI (Pollutants Standards Index) data in Singapore? Time series plot O Dot plot Boxplot O Histrogram
Step by Step Solution
There are 3 Steps involved in it
1 Expert Approved Answer
Step: 1 Unlock

Question Has Been Solved by an Expert!
Get step-by-step solutions from verified subject matter experts
Step: 2 Unlock
Step: 3 Unlock