

Question: Which method makes more sense? There are actually at least three methods for valuing a company: the DDM (dividend discount model), discounting free cash flows
 Which method makes more sense?
There are actually at least three methods for valuing a company: the DDM (dividend discount model), discounting free cash flows and valuation by comparables, described below. Which one do you think makes more sense in practice?
Valuation by comparables
We talked a lot about the DDM and FCF models but the most commonly used method of valuation is actually by comparables. This method uses financial statements and market comparables to estimate firm value.
One approach to firm valuation is to focus on the firms book value, either as it appears on the balance sheet or adjusted to reflect the current replacement cost of assets or the liquidation value.
Stock market analysts devote considerable attention to a companys priceearnings ratio. The P/E ratio is a useful measure of the markets assessment of the firms growth opportunities.
Firms with no growth opportunities should have a P/E ratio that is just the reciprocal of the cost of equity, k. As growth opportunities become a progressively more important component of the total value of the firm, the P/E ratio will increase.
Many analysts form their estimates of a stocks value by multiplying their forecast of next years EPS by a predicted P/E multiple. Some analysts mix the P/E approach with the dividend discount model. They use an earnings multiplier to forecast the terminal value of shares at a future date and add the present value of that terminal value with the present value of all interim dividend payments.
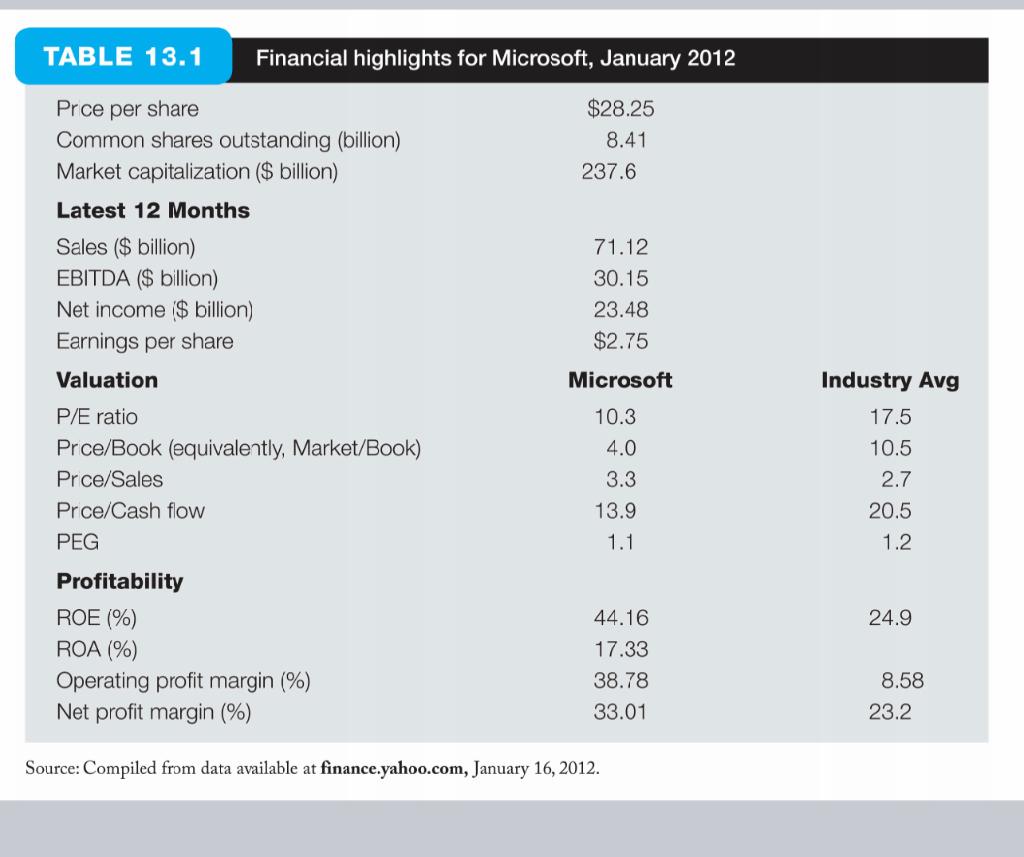
The attached picture shows some valuation ratios and other financial highlights for Microsoft in 2012 as well as some comparable data for other firms in the software applications industry. These valuation ratios are commonly used to assess the valuation of one firm compared to others in the same industry. For example, if Microsoft would have traded at the average PE of 17.5 for the industry it should have sported a price of ($2.75 * 17.5), much more than its actual price per share of 28.25 at that time.
DB - valuation-by-comparables-financial-highlights-for-microsoft.pdf
Source: Compiled from data available at finance.yahoo.com, January 16, 2012. Source: Compiled from data available at finance.yahoo.com, January 16, 2012
Step by Step Solution
There are 3 Steps involved in it

Get step-by-step solutions from verified subject matter experts