

Question: Which of the two scatter plots below, where the solid lines are the fitted regression lines, has potential influential points? Fig1. FigZ. 100 100 so

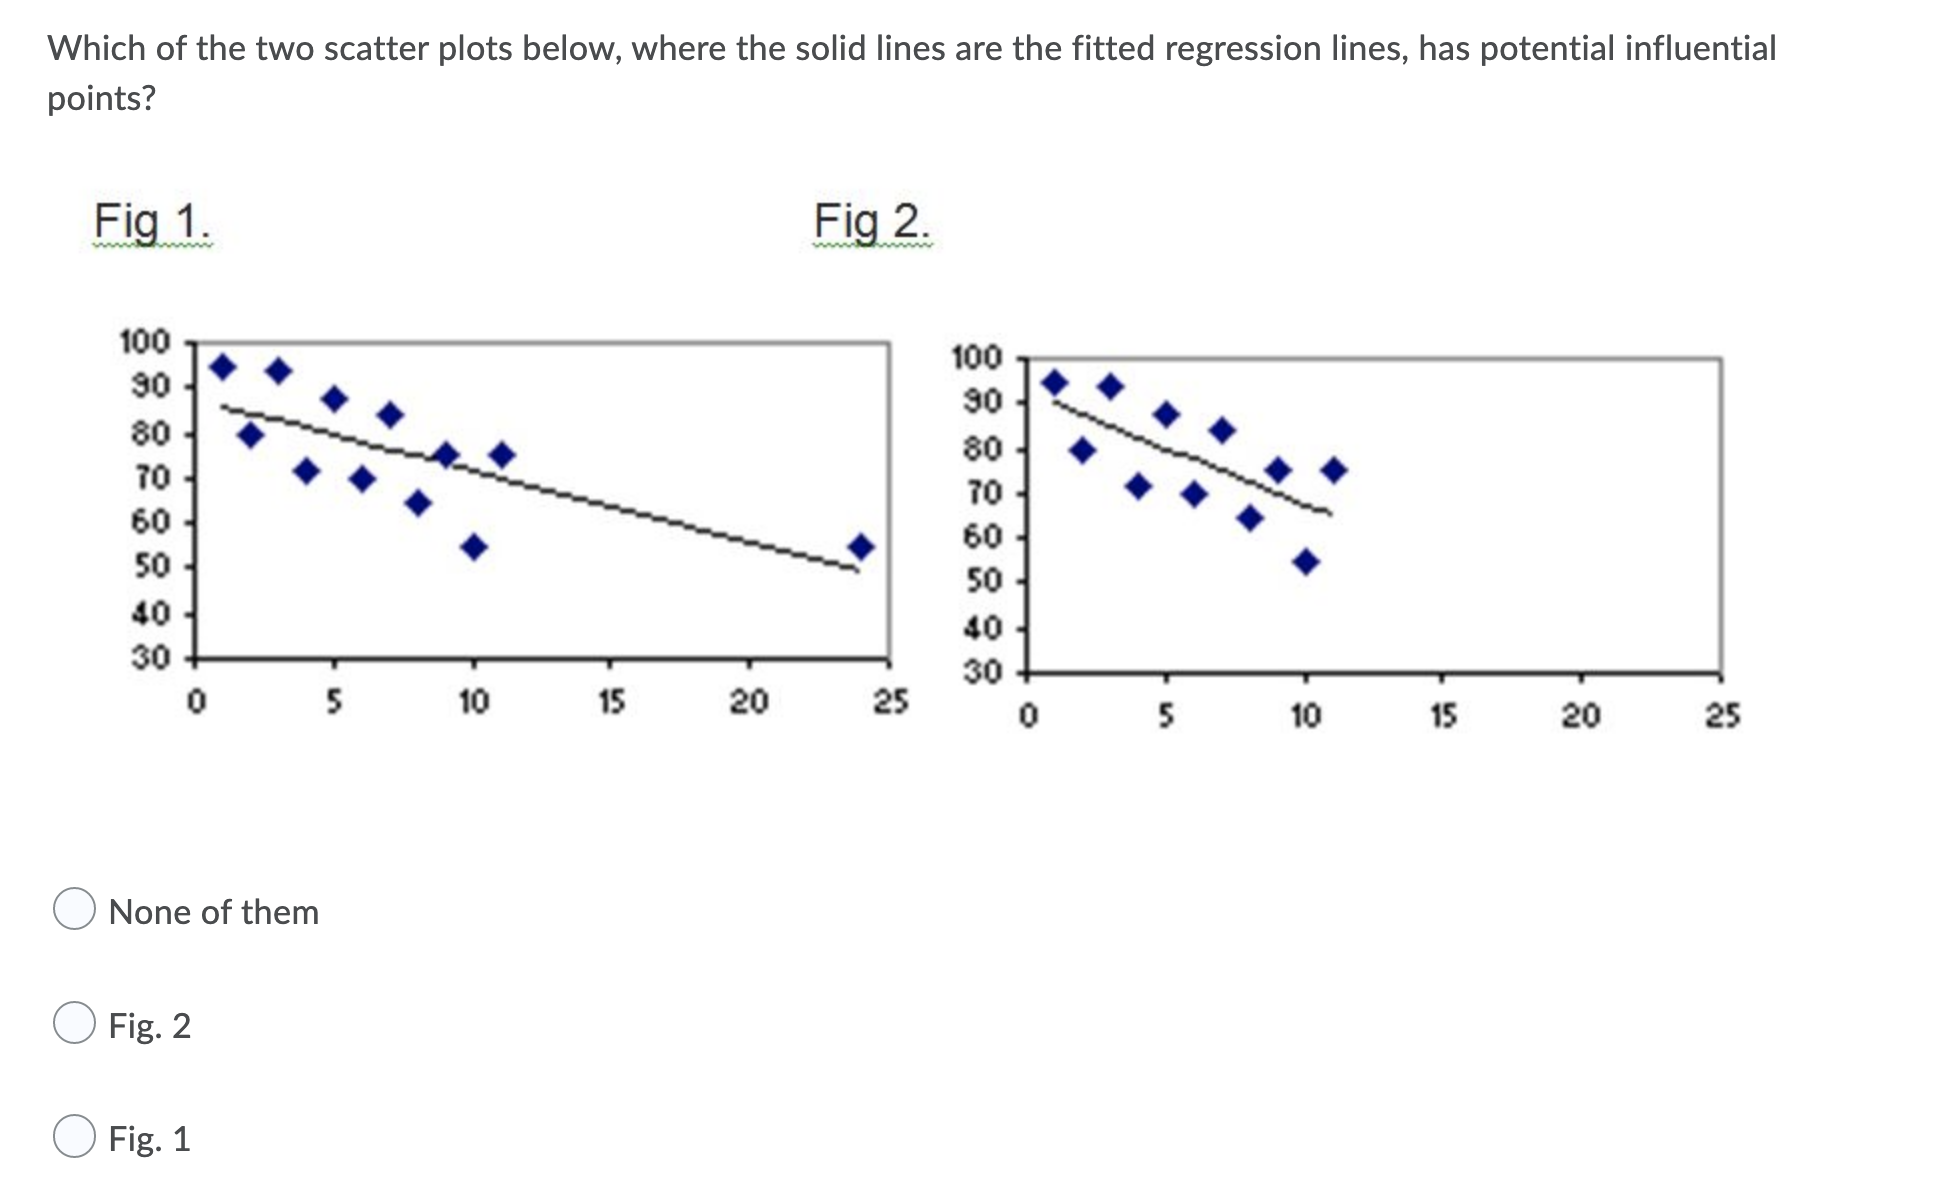
Which of the two scatter plots below, where the solid lines are the fitted regression lines, has potential influential points? Fig1. FigZ. 100 100 so ,0 99 so 9 .' 0 so so 9 so so 9 ' 40 3 oo o s 10 IS 20 as 0 None of them C) Fig. 2 C) Fig. 1
Step by Step Solution
There are 3 Steps involved in it
1 Expert Approved Answer
Step: 1 Unlock

Question Has Been Solved by an Expert!
Get step-by-step solutions from verified subject matter experts
Step: 2 Unlock
Step: 3 Unlock