

Question: Which one of the graphs below represents a production function withboth increasing and decreasing returns to scale? 70. Which one of the graphs below could
Which one of the graphs below represents a production function withboth increasing and decreasing returns to scale?
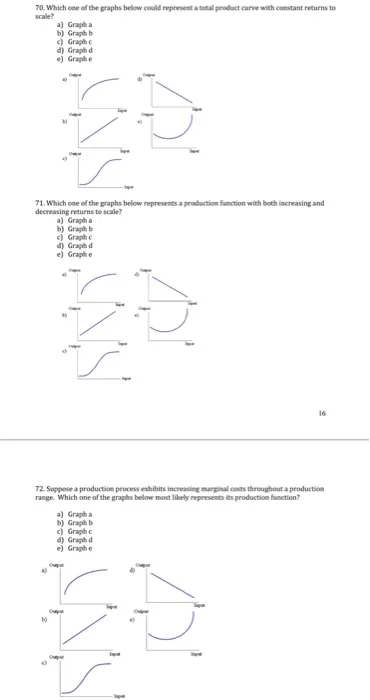
70. Which one of the graphs below could represent a total product curve with constant returns to scale? a) Graphia b) Graph b Graph c d) Graph d e) Graph e 1. Which one of the graphs below represents a production function with both increasing and decreasing returns to scale? a) Graph a b) Graph b Graph c d) Graph d e) Graph e range. Which one of the graphs below most likely repiresents its production function? a) Graph a b) Graphb c) Graph c d) Graphd e) Graph e
70. Which one of the graphs below could represent a total product curve with constant returns to scale? a) Graph a b) Graph b
Step by Step Solution
There are 3 Steps involved in it
1 Expert Approved Answer
Step: 1 Unlock

Question Has Been Solved by an Expert!
Get step-by-step solutions from verified subject matter experts
Step: 2 Unlock
Step: 3 Unlock