

Question: Which patterns are observable in the demand graph for Product 2? Trend and/or seasonality and/or cycles and/or randomness? Note that there might be more than
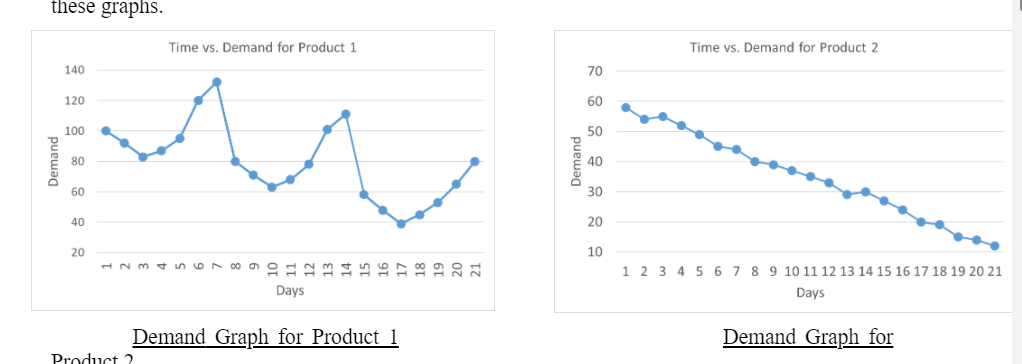
Which patterns are observable in the demand graph for Product 2? Trend and/or seasonality and/or cycles and/or randomness? Note that there might be more than one patterns. Which time series forecasting method is the most suitable for forecasting the demand for Product 2? Moving-Average or Exponential Smoothing or Trend-Corrected Exponential Smoothing (Holts Method) or Trend- and Seasonality-Corrected Exponential Smoothing (Holt-Winters Method)? (2-3 sentences in total).
If you did not have any data about Product 1 considering that it is a new product, how would you use forecasting by analogy to forecast the demand for Product 1? Briefly explain (2-3 sentences).
-
If you must use Moving-Average method for Product 2, should you consider more or fewer recent observations? That is, should N (the parameter of Moving-Average method) be larger or smaller? Explain why briefly (2-3 sentences).
Answer:
-
How can you use forecast errors to evaluate the biasedness of a forecasting method? Briefly explain (2-3 sentences).
Step by Step Solution
There are 3 Steps involved in it

Get step-by-step solutions from verified subject matter experts