

Question: Which plot represent a stemplot of data? mathxl.com/Student/PlayerHomework.aspx?homeworkld-5631341 14&questionld=16&flushed=true&cld=5972127¢erwin=yes Statistics (b) michelene louis & 04/08/20 9:09 PM Homework: Week 1 Homework (2.1-2.4) Sav Score: 0
Which plot represent a stemplot of data?
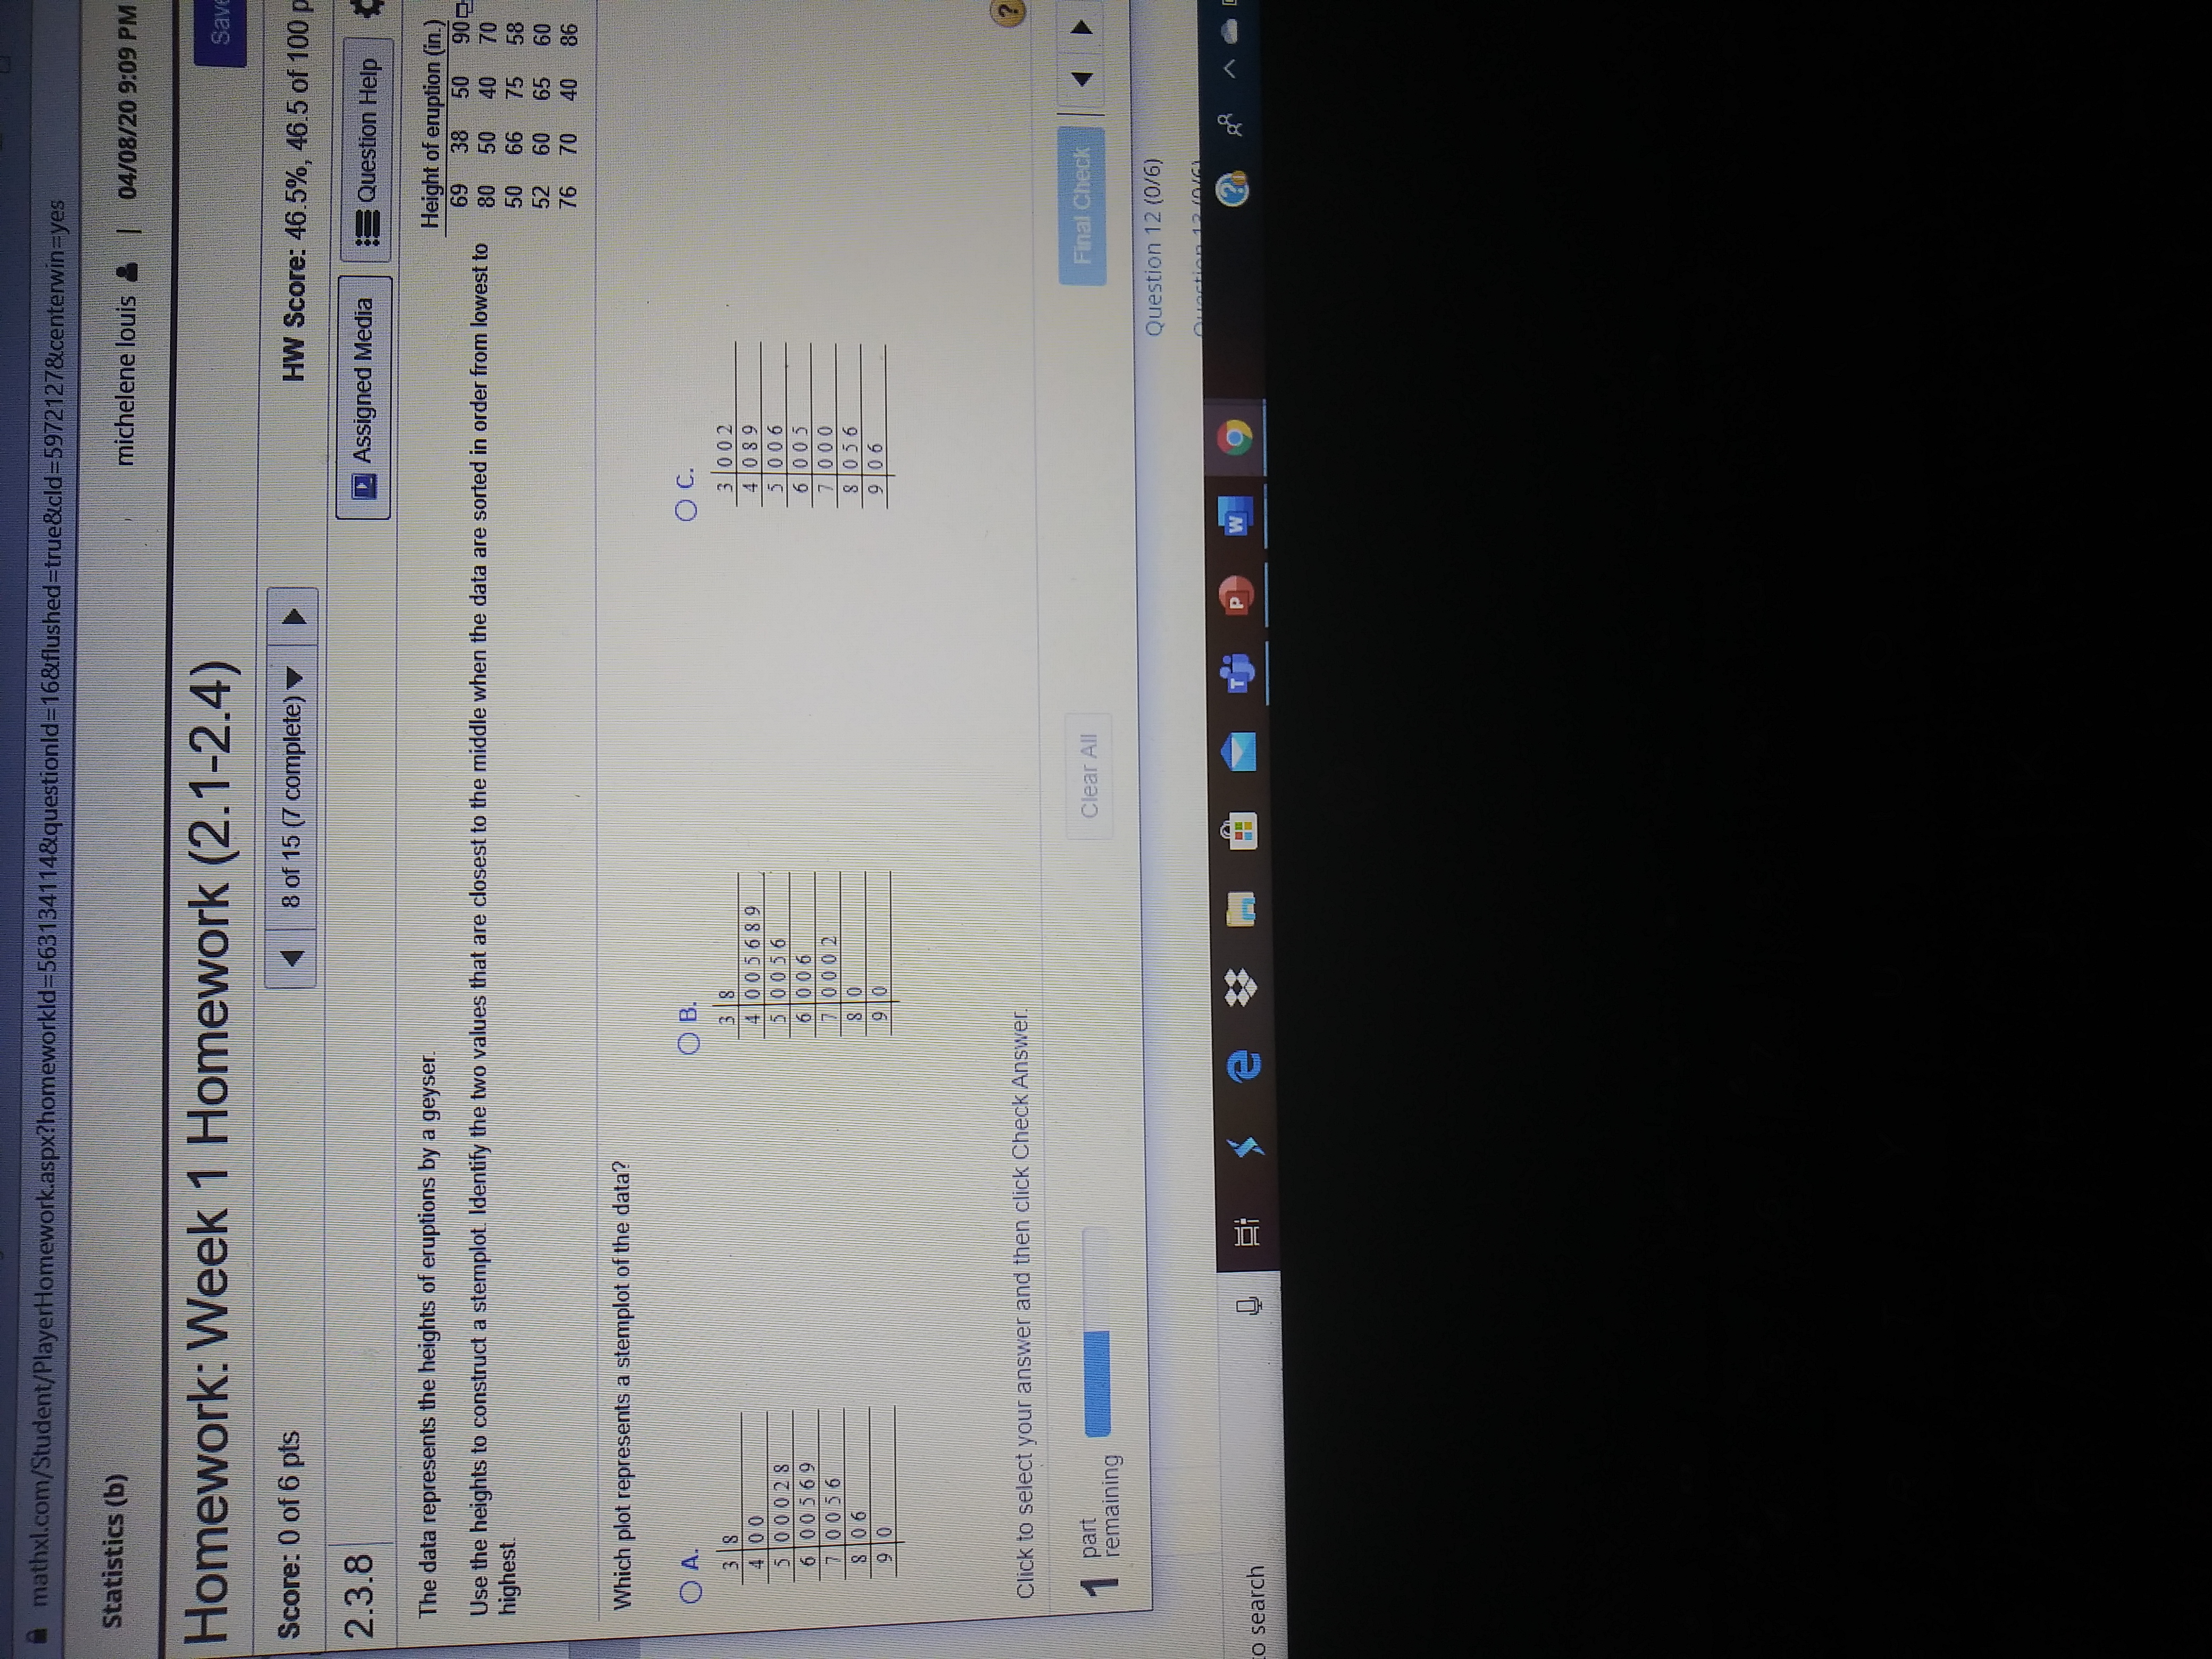
mathxl.com/Student/PlayerHomework.aspx?homeworkld-5631341 14&questionld=16&flushed=true&cld=5972127¢erwin=yes Statistics (b) michelene louis & 04/08/20 9:09 PM Homework: Week 1 Homework (2.1-2.4) Sav Score: 0 of 6 pts 8 of 15 (7 complete) HW Score: 46.5%, 46.5 of 100 2.3.8 Assigned Media Question Help The data represents the heights of eruptions by a geyser Height of eruption (in.) Use the heights to construct a stemplot. Identify the two values that are closest to the middle when the data are sorted in order from lowest to 69 38 50 90 highest. 80 50 40 50 52 66 70 60 75 58 76 70 65 60 40 86 Which plot represents a stemplot of the data? O A. DB. O C. 3 8 4 00 3 8 4 60 5689 3 002 5 0 0 028 50656 4 089 6 00569 6 006 5 006 6 005 7 0056 70 00 8 056 9 06 Click to select your answer and then click Check Answer part remaining Clear All Final Check Question 12 (0/6) P W o search 9
Step by Step Solution
There are 3 Steps involved in it

Get step-by-step solutions from verified subject matter experts