

Question: Which pseudocode option will give the same output as the given flow diagram? This flow diagram determines the average estimated proportion of children ( 0
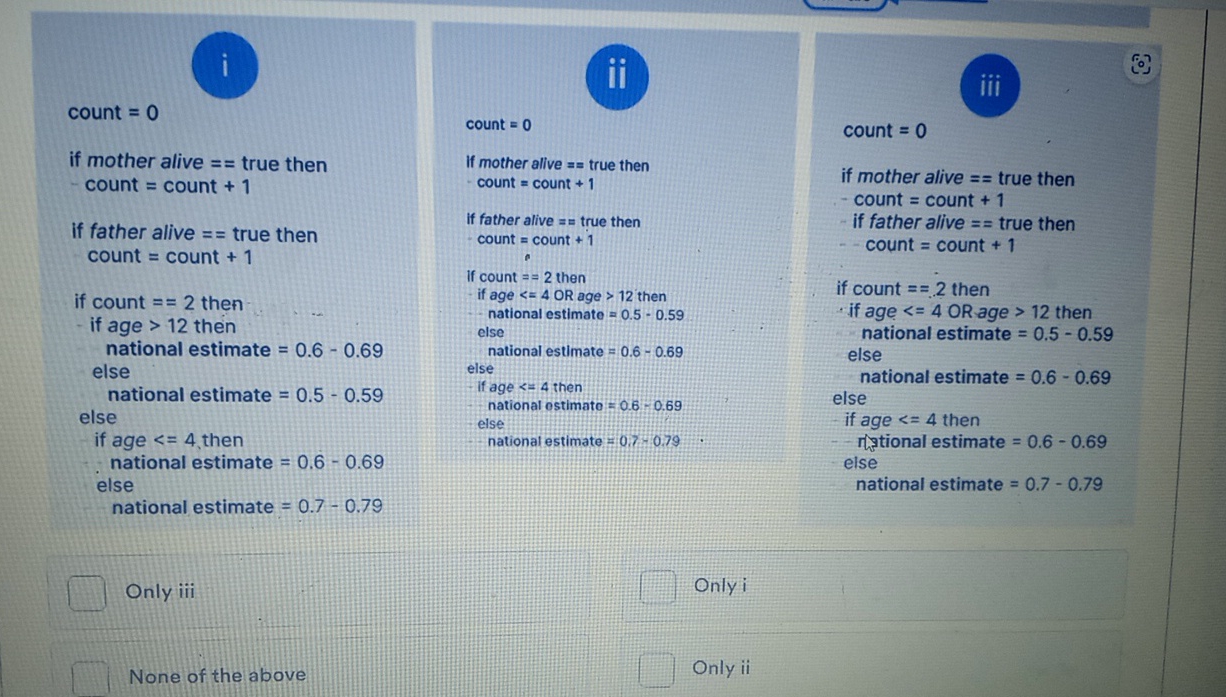
Which pseudocode option will give the same output as the given flow diagram?
This flow diagram determines the average estimated proportion of children Age living in multidimensional poverty in South Africa due to orphanhood and age as per a UNICEF United Nations International Children's Emergency Fund report of
count
if mother alive true then count count
if father alive true then count count
if count then
if age then national estimate else national estimate
else if age then national estimate else national estimate
count
If mother allive true then count count
If father alive true then count count
If count then if age OR age then national estimate else national estimate else If age then national ostimato else nationalestimate :
count
if mother alive true then count count
if father alive true then count count
if count then
if age OR age then national estimate else national estimate else
if age then
Mytional estimate else national estimate
Only iii Only i
None of the above Only ii
Step by Step Solution
There are 3 Steps involved in it
1 Expert Approved Answer
Step: 1 Unlock

Question Has Been Solved by an Expert!
Get step-by-step solutions from verified subject matter experts
Step: 2 Unlock
Step: 3 Unlock