

Question: Which scatterplot best shows the positive correlation between hours studied and test scores? A. 100 C. Test Scores Test Scores 0 1 2 3 4
Which scatterplot best shows the positive correlation between hours studied and test scores?
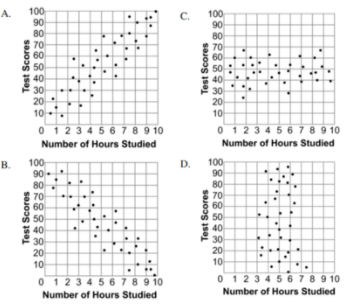
A. 100 C. Test Scores Test Scores 0 1 2 3 4 56 7 8 910 0 123456 78 910 Number of Hours Studied Number of Hours Studied B. 100 D. 100 90 % 90 Test Scores Test Scores 388 85832 0 12 3 4 56 7 8 910 0 123456 78 910 Number of Hours Studied Number of Hours Studied
Step by Step Solution
There are 3 Steps involved in it
1 Expert Approved Answer
Step: 1 Unlock

Question Has Been Solved by an Expert!
Get step-by-step solutions from verified subject matter experts
Step: 2 Unlock
Step: 3 Unlock