

Question: Which statistical method could be used to compare the odds of heart disease given a history or not of a high fat diet? The outcome
- Which statistical method could be used to compare the odds of heart disease given a history or not of a high fat diet? The outcome variable (Y) is heart disease (0=no, 1=yes), with the event of interest being heart disease (1=yes). The explanatory variable (X) is non-exposure (0) or exposure (1) to a high fat diet on a regular basis in the past.
- A.CMH Test
- B.Odds Ratio with 95% CI
- C.NcNemar Test
- D.T-test
2.Which statistical method could be used to compare the odds of heart disease given a history or not of a high fat diet? The outcome variable (Y) is heart disease (0=no, 1=yes), with the event of interest being heart disease (1=yes). The explanatory variable (X) is non-exposure (0) or exposure (1) to a high fat diet on a regular basis in the past.
a. CMH Test
b. Odds Ratio with 95% CI
c. NcNemar Test
d. T-test
3 See SPSS Analysis below. Among those adolescents randomized to PBO, what percent were mildly depressed based on the CGIS scores?(mildly depressed=CGIS 3)
- A.1.4%
- B.1.8%
- C.2.0%
- D.2.7%
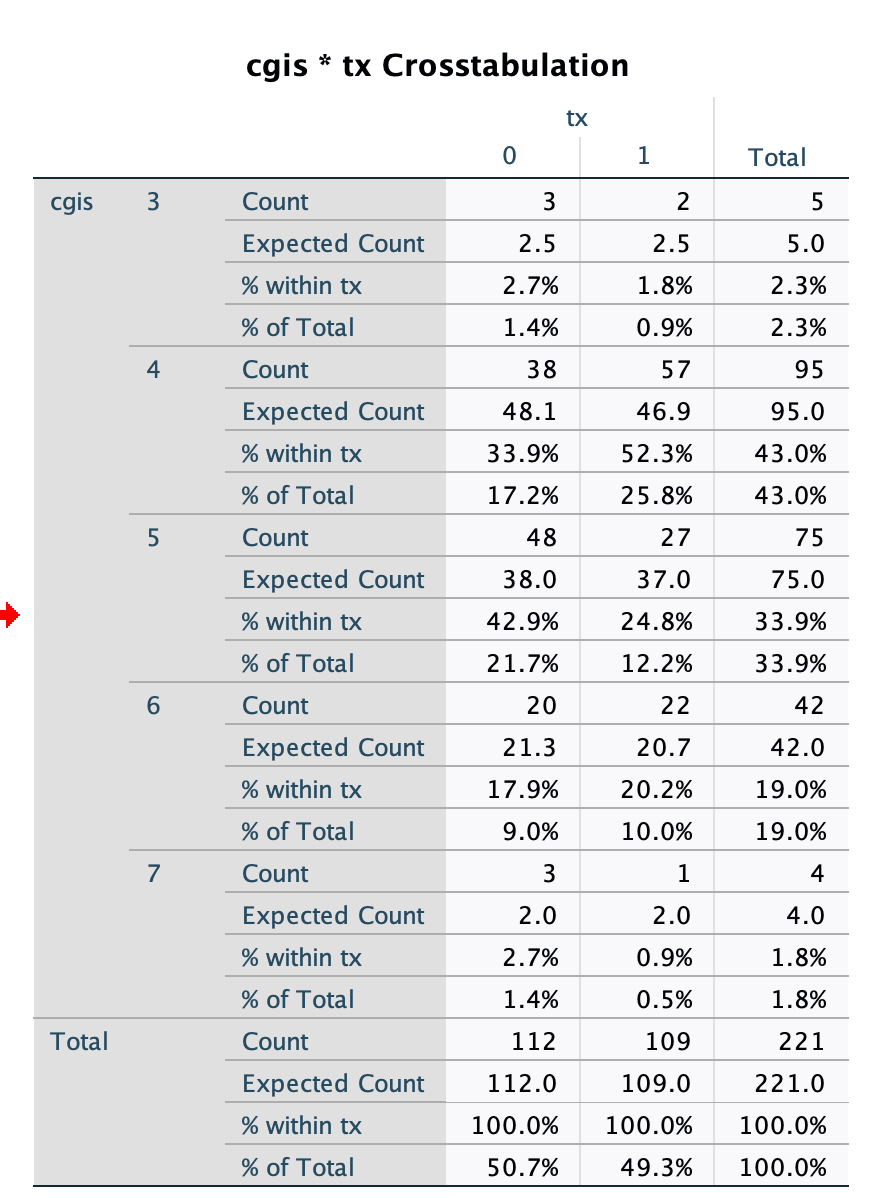
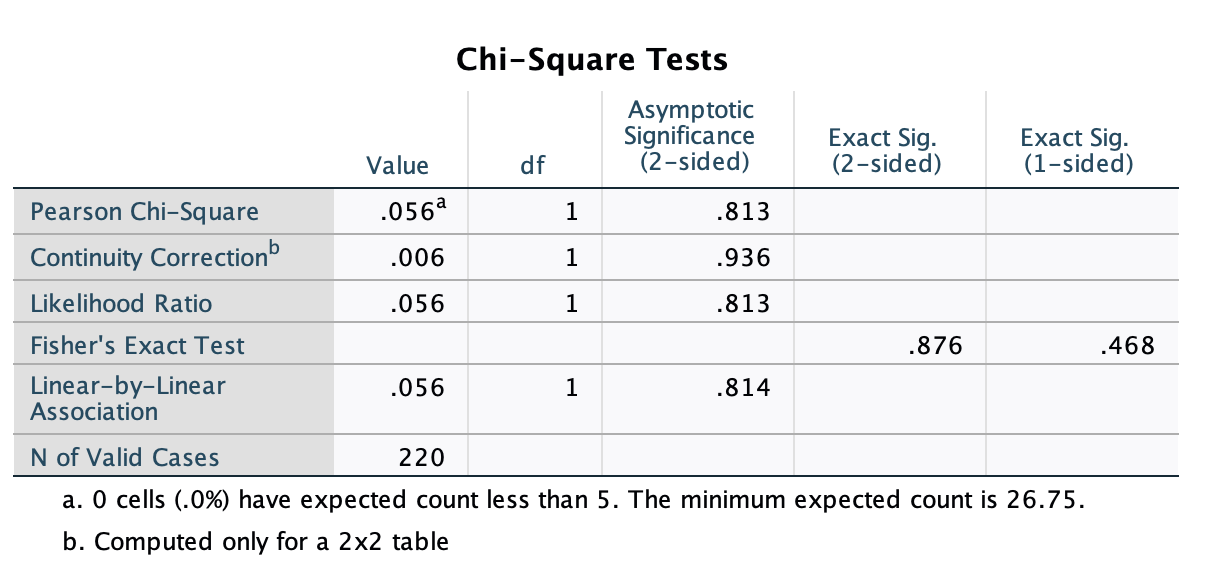
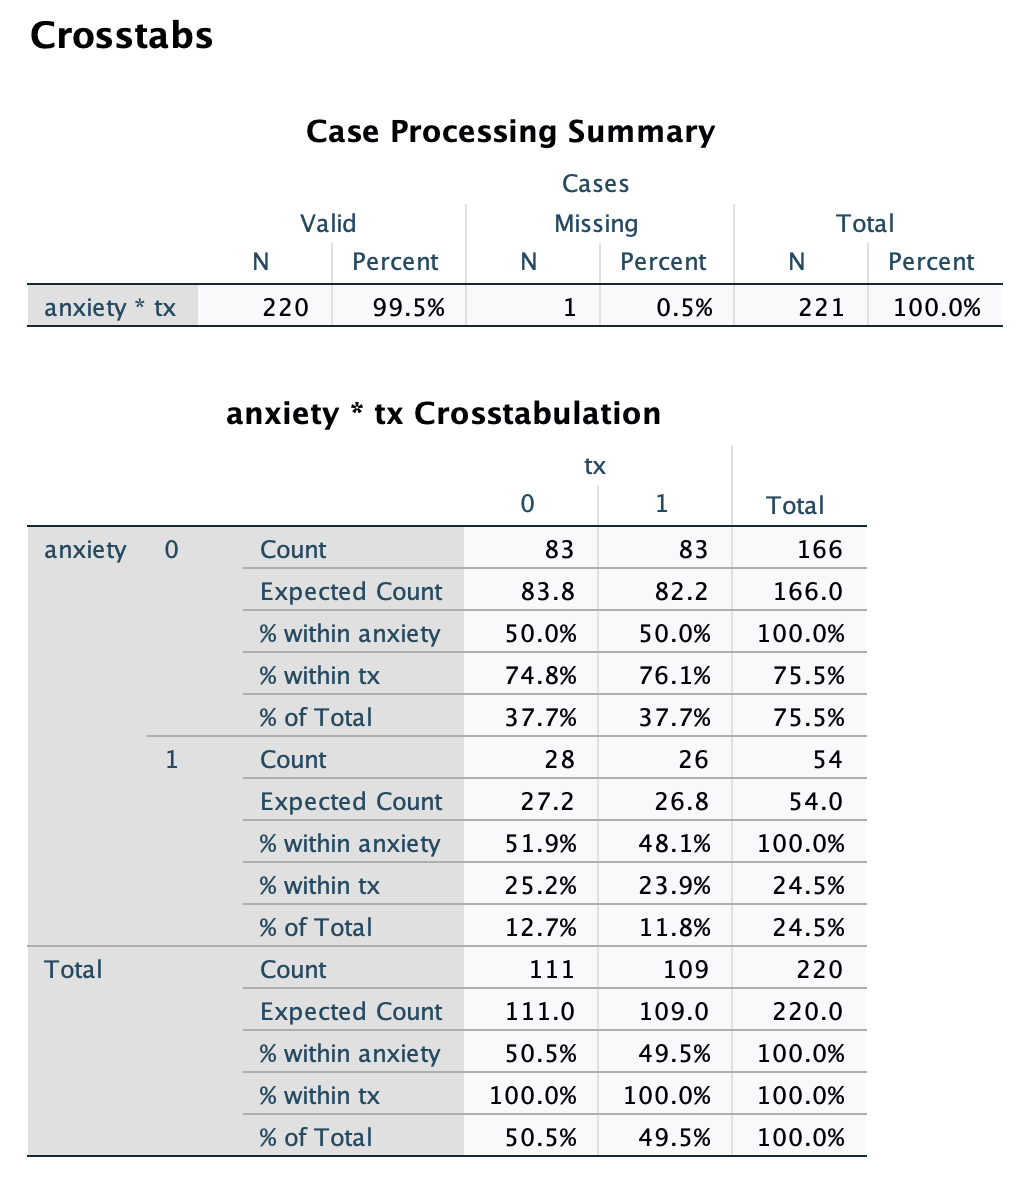
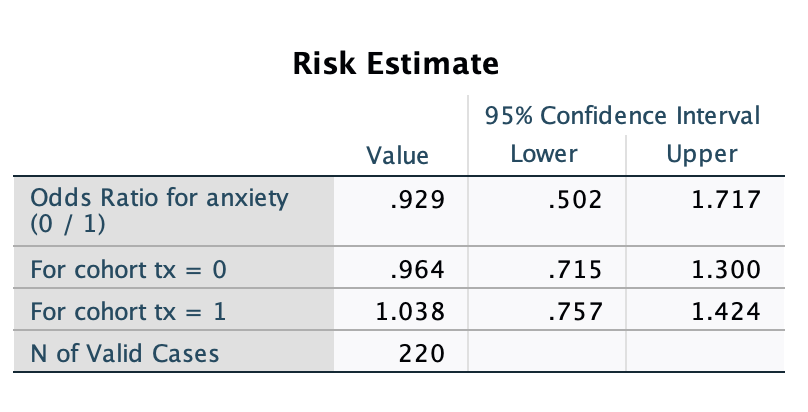
cgis * tx Crosstabulation tx 0 1 Total cgis 3 Count 3 2 5 Expected Count 2.5 2.5 5.0 % within tx 2.7% 1.8% 2.3% % of Total 1.4% 0.9% 2.3% 4 Count 38 57 95 Expected Count 48.1 46.9 95.0 % within tx 33.9% 52.3% 43.0% % of Total 17.2% 25.8% 43.0% UT Count 48 27 75 Expected Count 38.0 37.0 75.0 % within tx 42.9% 24.8% 33.9% % of Total 21.7% 12.2% 33.9% 6 Count 20 22 42 Expected Count 21.3 20.7 42.0 % within tx 17.9% 20.2% 19.0% % of Total 9.0% 10.0% 19.0% 7 Count 3 1 4 Expected Count 2.0 2.0 4.0 % within tx 2.7% 0.9% 1.8% % of Total 1.4% 0.5% 1.8% Total Count 112 109 221 Expected Count 112.0 109.0 221.0 % within tx 100.0% 100.0% 100.0% % of Total 50.7% 49.3% 100.0%Chi-Square Tests Asymptotic Significance Value df (2-sided) Exact Sig. (2-sided) Exact Sig. (1-sided) Pearson Chi-Square .056a 1 .813 Continuity Correction .006 .936 Likelihood Ratio .056 .813 Fisher's Exact Test .876 .468 Linear-by-Linear Association .056 814 N of Valid Cases 220 a. 0 cells (.0%) have expected count less than 5. The minimum expected count is 26.75. b. Computed only for a 2x2 tableCrosstabs Case Processing Summary Cases Valid Missing Total N Percent N Percent N Percent anxiety * tx 220 99.5% 1 0.5% 221 100.0% anxiety * tx Crosstabulation tx 0 H Total anxiety 0 Count 83 83 166 Expected Count 83.8 82.2 166.0 % within anxiety 50.0% 50.0% 100.0% % within tx 74.8% 76.1% 75.5% % of Total 37.7% 37.7% 75.5% Count 28 26 54 Expected Count 27.2 26.8 54.0 % within anxiety 51.9% 48.1% 100.0% % within tx 25.2% 23.9% 24.5% % of Total 12.7% 1 1.8% 24.5% Total Count 111 109 220 Expected Count 111.0 109.0 220.0 % within anxiety 50.5% 49.5% 100.0% % within tx 100.0% 100.0% 100.0% % of Total 50.5% 49.5% 100.0%Risk Estimate 95% Confidence Interval Value Lower Upper Odds Ratio for anxiety .929 .502 1.717 (0 / 1) For cohort tx = 0 .964 .715 1.300 For cohort tx = 1 1.038 .757 1.424 N of Valid Cases 220
Step by Step Solution
There are 3 Steps involved in it

Get step-by-step solutions from verified subject matter experts