

Question: Why given analysis is statistically significant? How each firm can be distinguished from each other statistically? Explain citing the relevant evidence from your Tukey HSD
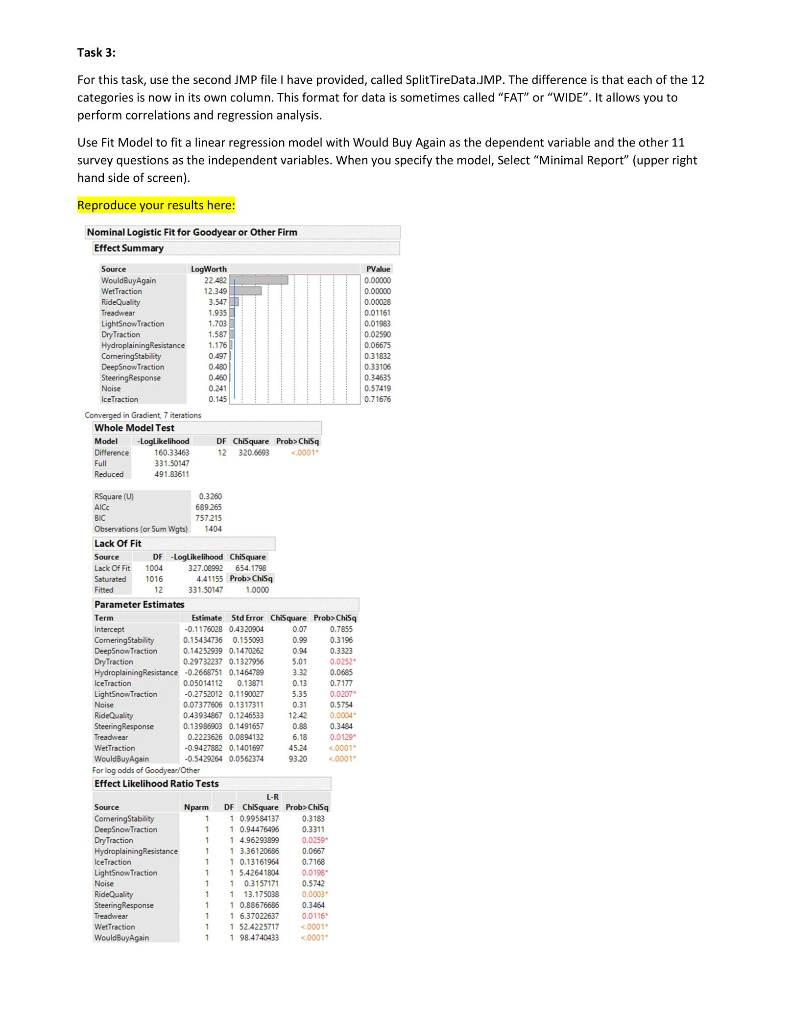

- Why given analysis is statistically significant?
- How each firm can be distinguished from each other statistically? Explain citing the relevant evidence from your Tukey HSD output above?
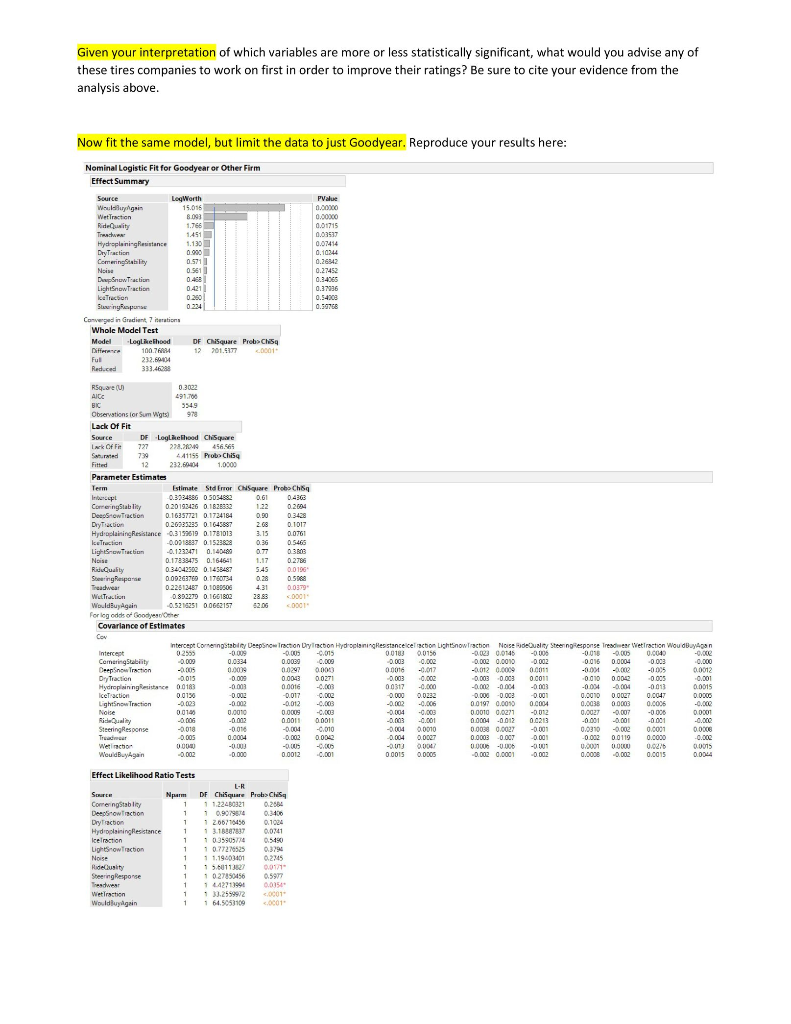
- How does limiting the analysis to just this category change the results?
- Please explain how you think Goodyear stands relative to its competitors with respect to run-on-flat tires:
Step by Step Solution
There are 3 Steps involved in it
1 Expert Approved Answer
Step: 1 Unlock

Question Has Been Solved by an Expert!
Get step-by-step solutions from verified subject matter experts
Step: 2 Unlock
Step: 3 Unlock