

Question: why is my code incorrect?how do i make a line graph with my data? include the code used? > Error: unexpected '>' in > Error:
why is my code incorrect?how do i make a line graph with my data? include the code used? 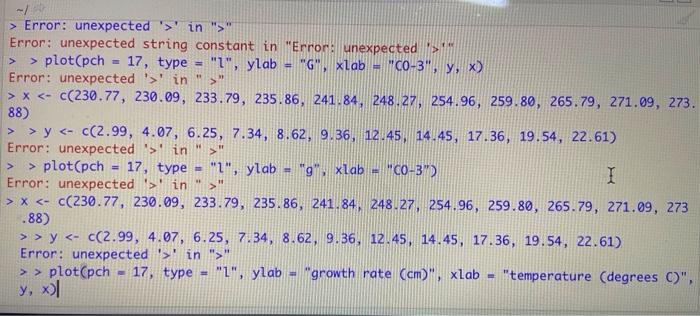
> Error: unexpected '>' in ">" Error: unexpected string constant in "Error: unexpected > > plot(pch 17, type = "1", ylab "G" xlab = "CO-3") y, x) Error: unexpected '>' in ">" > X > y ' in >" > plot(pch 17, type "1", ylab = " gxlab = "CO-3) I Error: unexpected '>' in > X > y ' in ">" > > plotCpch 17, type = "1", ylab - "growth rate (cm)", xlab = "temperature (degrees C)", > y, xol
Step by Step Solution
There are 3 Steps involved in it
1 Expert Approved Answer
Step: 1 Unlock

Question Has Been Solved by an Expert!
Get step-by-step solutions from verified subject matter experts
Step: 2 Unlock
Step: 3 Unlock