

Question: Why the answer is B, how did we calculate it? The following table represent partial information about regression analysis: a. the value of the measured
Why the answer is B, how did we calculate it? 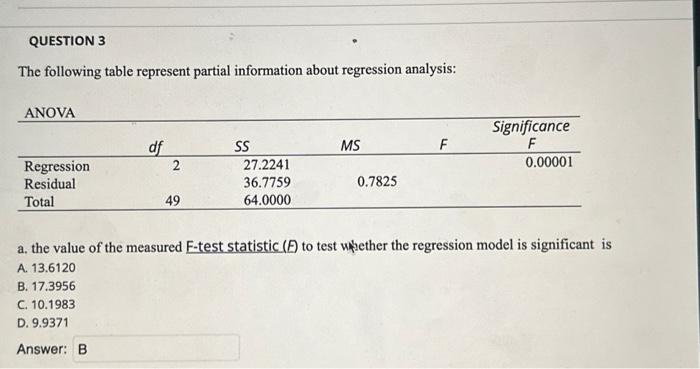
The following table represent partial information about regression analysis: a. the value of the measured F-test statistic (P) to test whether the regression model is significant is A. 13.6120 B. 17.3956 C. 10.1983 D. 9.937
Step by Step Solution
There are 3 Steps involved in it
1 Expert Approved Answer
Step: 1 Unlock

Question Has Been Solved by an Expert!
Get step-by-step solutions from verified subject matter experts
Step: 2 Unlock
Step: 3 Unlock