

Question: Why you chose the this particular plot that you have provided, and what they convey about your data. Briefly describe what each plot is intended
Why you chose the this particular plot that you have provided, and what they convey about your data. Briefly describe what each plot is intended to illustrate, pointing out key features about the dataset that they are intended to visualize.
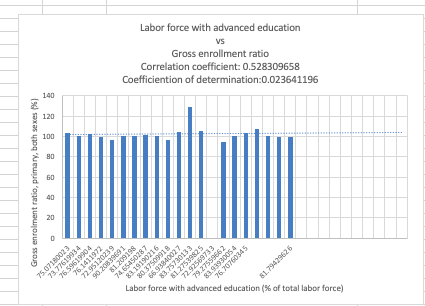
Labor force with advanced education VS Gross enrollment ratio Correlation coefficient: 0.528309658 Coefficiention of determination:0.023641196 140 120 100 60 Gross enrolment ratio, primary, both sexes (X] 40 30 023 1972 $2 20239 3982 373013 1776199 96190 90.2083969 1.19190216 .071 76.14 81.20 74.65450 3750 6.938400 72.92569733 9.27559 193930 81.79429626 2.95 76. 70760 25. $1.2. Labor force with advanced education (5% of total labor force)
Step by Step Solution
There are 3 Steps involved in it

Get step-by-step solutions from verified subject matter experts