

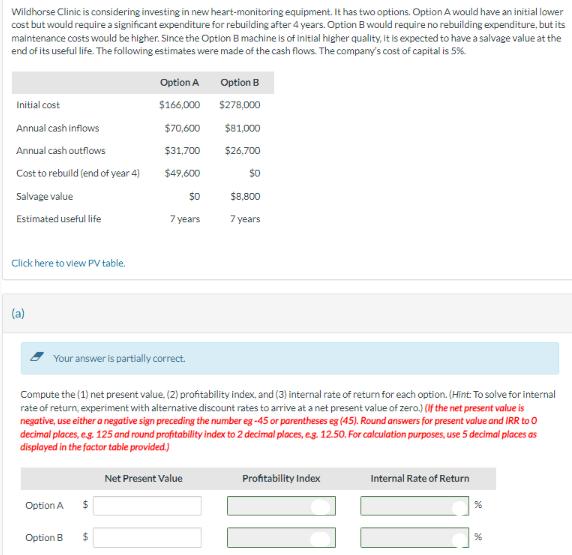
Wildhorse Clinic is considering investing in new heart-monitoring equipment. It has two options. Option A would...
Fantastic news! We've Found the answer you've been seeking!
Question:
Transcribed Image Text:
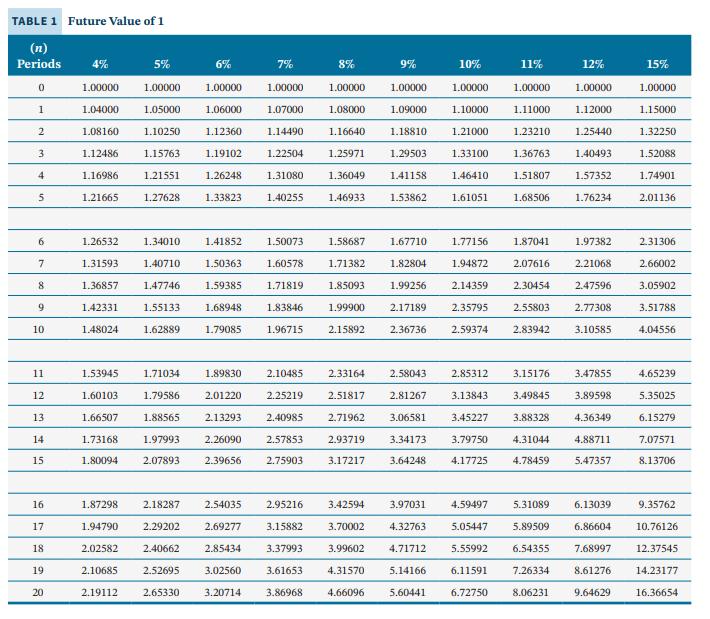
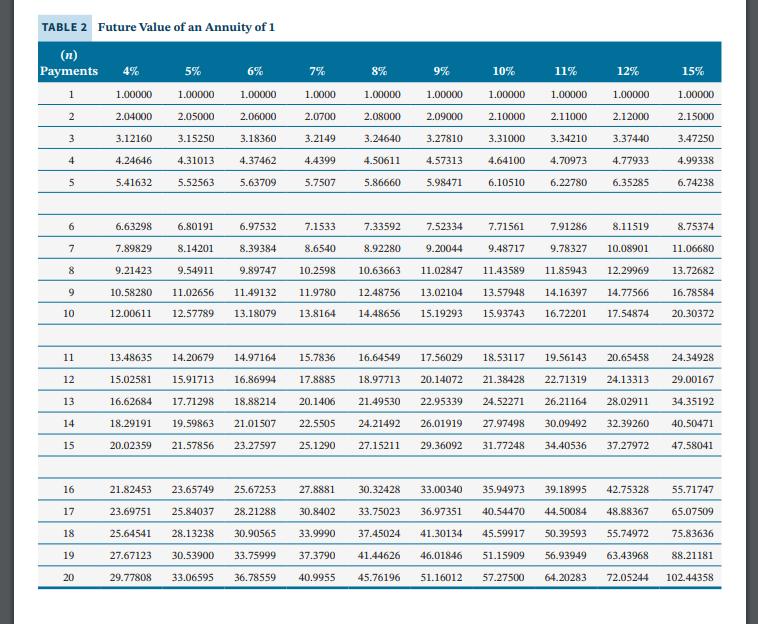
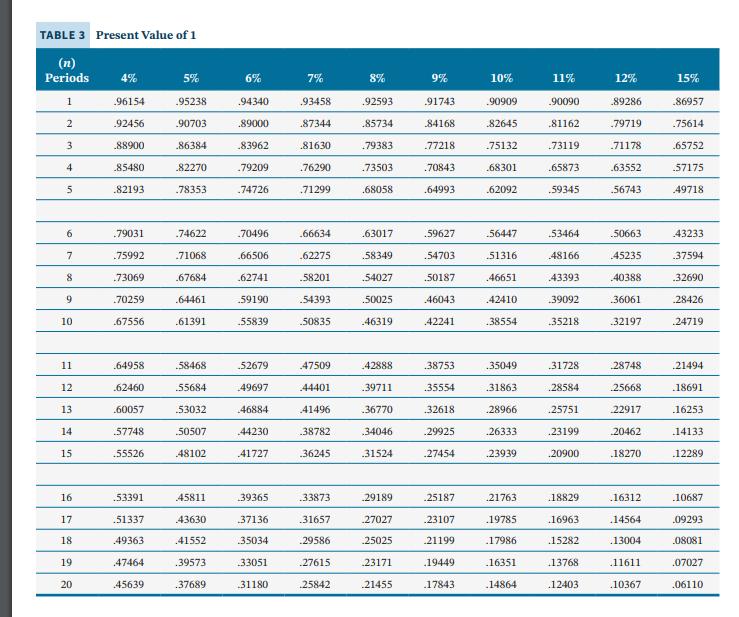
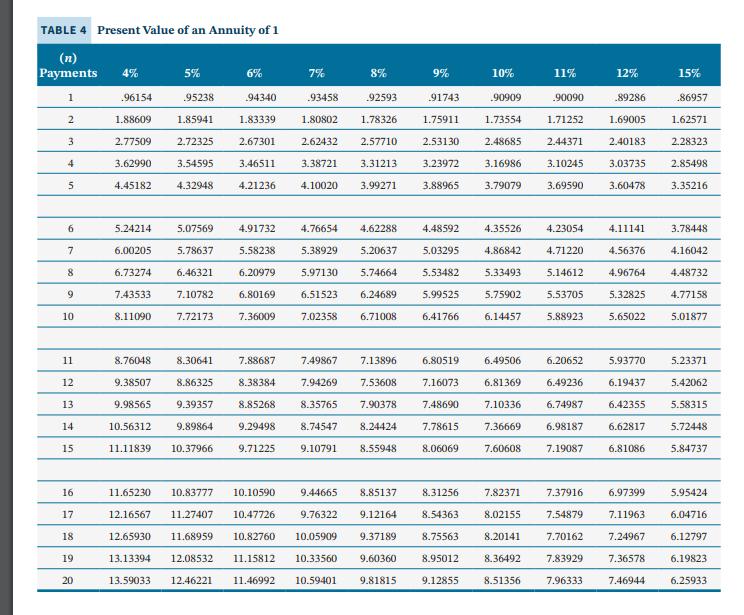
Wildhorse Clinic is considering investing in new heart-monitoring equipment. It has two options. Option A would have an initial lower cost but would require a significant expenditure for rebuilding after 4 years. Option B would require no rebuilding expenditure, but its maintenance costs would be higher. Since the Option B machine is of initial higher quality, it is expected to have a salvage value at the end of its useful life. The following estimates were made of the cash flows. The company's cost of capital is 5%. Initial cost Annual cash inflows Annual cash outflows Cost to rebuild (end of year 4) Salvage value Estimated useful life Click here to view PV table. (a) Your answer is partially correct. Option A Option B Option A $166,000 $70,600 $31,700 $49,600 $ $ 7 years Compute the (1) net present value. (2) profitability index, and (3) internal rate of return for each option. (Hint: To solve for internal rate of return, experiment with alternative discount rates to arrive at a net present value of zero.) (If the net present value is negative, use either a negative sign preceding the number eg -45 or parentheses eg (45). Round answers for present value and IRR to O decimal places, e.g. 125 and round profitability index to 2 decimal places, e.g. 12.50. For calculation purposes, use 5 decimal places as displayed in the factor table provided.) $0 Net Present Value Option B $278,000 $81,000 $26.700 $0 $8,800 7 years Profitability Index Internal Rate of Return % % TABLE 1 Future Value of 1 (n) Periods 4% 0 1 2 3 4 5 6 7 8 9 10. 11 12 13 14 15 16 17 18 19 20 5% 1.00000 1.05000 1.10250 1.12486 1.15763 1.16986 1.21551 1.21665 1.27628 1.00000 1.04000 1.08160 1.26532 1.31593 1.36857 1.42331 1.48024 1.53945 1.60103 1.66507 1.73168 1.80094 1.34010 1.40710 1.47746 1.55133 1.62889 6% 1.00000 1.06000 1.12360 1.19102 1.26248 1.31080 1.33823 1.40255 1.71034 1.79586 1.88565 1.97993 2.26090 2.07893 2.39656 7% 1.41852 1.50073 1.50363 1.60578 1.59385 1.71819 1.68948 1.83846 1.79085 1.96715 1.89830 2.10485 2.01220 2.25219 2.13293 2.40985 2.57853 2.75903 1.00000 1.07000 1.14490 1.22504 1.87298 2.18287 1.94790 2.29202 2.02582 2.40662 2.10685 2.52695 2.19112 2.65330 3.20714 3.02560 8% 1.00000 1.08000 1.16640 1.25971 1.36049 1.46933 9% 10% 1.00000 1.09000 1.10000 1.21000 1.33100 1.46410 1.61051 2.15892 1.00000 1.18810 1.29503 1.41158 1.53862 1.58687 1.67710 1.71382 1.82804 1.85093 1.99256 1.99900 2.17189 2.36736 2.54035 2.95216 3.42594 3.97031 2.69277 3.15882 3.70002 4.32763 2.85434 3.37993 3.99602 4.71712 3.61653 4.31570 5.14166 3.86968 4.66096 5.60441 1.77156 1.94872 2.14359 2.35795 2.59374 2.33164 2.58043 2.85312 2.51817 2.81267 3.13843 2.71962 3.06581 3.45227 3.79750 2.93719 3.34173 3.17217 3.64248 4.17725 11% 1.00000 1.11000 1.12000 1.23210 1.25440 1.36763 1.40493 1.51807 1.57352 1.76234 6.11591 1.68506 3.15176 12% 1.87041 1.97382 2.07616 2.21068 2.30454 2.47596 2.55803 2.77308 2.83942 3.10585 4.59497 5.31089 5.05447 5.89509 5.55992 6.54355 7.26334 6.72750 8.06231 1.00000 3.47855 3.89598 4.36349 4.88711 3.49845 3.88328 4.31044 4.78459 5.47357 15% 1.00000 1.15000 1.32250 1.52088 1.74901 2.01136 2.31306 2.66002 3.05902 3.51788 4.04556 4.65239 5.35025 6.15279 7.07571 8.13706 6.13039 9.35762 6.86604 10.76126 7.68997 12.37545 8.61276 14.23177 9.64629 16.36654 TABLE 2 Future Value of an Annuity of 1 (n) Payments 4% 1 2 3 4 5 6 7 8 9 10 11 12 13 14 15 16 17 18 19 20 1.00000 2.04000 3.12160 4.24646 5.41632 6.63298 5% 1.00000 7.89829 2.05000 3.15250 2.06000 3.18360 4.31013 4.37462 5.52563 5.63709 6% 1.00000 13.48635 14.20679 15.02581 15.91713 16.62684 17.71298 18.29191 19.59863 20.02359 21.57856 21.82453 23.65749 23.69751 25.84037 25.64541 28.13238 27.67123 30.53900 29.77808 33.06595 7.33592 8.92280 9.89747 10.2598 10.63663 9.21423 10.58280 11.02656 11.49132 11.9780 12.48756 12.00611 12.57789 13.18079 13.8164 14.48656 7% 6.80191 6.97532 7.1533 8.14201 8.39384 8.6540 9.54911 1.0000 2.0700 3.2149 4.4399 5.7507 18.88214 8% 9% 10% 1.00000 1.00000 1.00000 2.08000 2.09000 2.10000 3.24640 3.27810 4.50611 4.57313 5.86660 5.98471 14.97164 15.7836 16.64549 16.86994 17.8885 18.97713 21.49530 22.95339 24.21492 26.01919 20.1406 21.01507 22.5505 23.27597 25.1290 27.15211 11% 12% 15% 1.00000 1.00000 1.00000 2.11000 2.12000 2.15000 3.37440 3.47250 4.77933 4.99338 6.35285 6.74238 3.31000 3.34210 4.64100 4.70973 6.22780 6.10510 7.52334 7.71561 7.91286 9.20044 9.48717 9.78327 10.08901 11.43589 11.85943 12.29969 13.72682 11.02847 13.02104 13.57948 14.16397 14.77566 16.78584 15.19293 15.93743 16.72201 17.54874 20.30372 8.11519 8.75374 11.06680 24.34928 17.56029 18.53117 19.56143 20.65458 20.14072 21.38428 22.71319 24.13313 24.52271 26.21164 28.02911 29.00167 34.35192 27.97498 30.09492 32.39260 40.50471 29.36092 31.77248 34.40536 37.27972 47.58041 25.67253 27.8881 30.32428 33.00340 35.94973 39.18995 42.75328 28.21288 30.8402 33.75023 36.97351 40.54470 44.50084 48.88367 30.90565 33.9990 37.45024 41.30134 45.59917 50.39593 55.74972 37.3790 41.44626 46.01846 51.15909 56.93949 63.43968 40.9955 45.76196 51.16012 33.75999 36.78559 55.71747 65.07509 75.83636 88.21181 57.27500 64.20283 72.05244 102.44358 TABLE 3 Present Value of 1 (n) Periods 4% 1 2 3 4 5 6 7 8 9 10 11 12 13 14 15 16 17 18 19 20 .96154 .92456 .88900 .85480 .82193 .79031 .75992 .73069 .70259 .67556 .64958 .62460 .60057 57748 .55526 .53391 51337 .49363 47464 45639 5% .95238 .90703 .86384 82270 .78353 .74622 .71068 .67684 .64461 .61391 58468 55684 53032 50507 48102 45811 43630 .41552 .39573 .37689 6% .94340 .89000 .83962 .79209 .74726 70496 .66506 .62741 59190 55839 52679 49697 46884 44230 41727 39365 .37136 35034 33051 31180 7% 93458 .87344 .81630 .76290 .71299 .66634 .62275 .58201 .54393 50835 .47509 .44401 41496 38782 .36245 .33873 .31657 29586 27615 25842 8% .92593 .85734 .79383 73503 .68058 .63017 58349 .54027 50025 .46319 42888 .39711 .36770 .34046 .31524 29189 27027 25025 23171 21455 9% .91743 84168 77218 .70843 .64993 .59627 .54703 .50187 46043 .42241 .38753 .35554 .32618 .29925 .27454 25187 .23107 21199 19449 .17843 10% .90909 .82645 75132 .68301 .62092 56447 51316 46651 .42410 .38554 .35049 .31863 .28966 26333 .23939 21763 .19785 .17986 .16351 .14864 11% .90090 .81162 73119 .65873 .59345 53464 48166 43393 39092 35218 .31728 28584 25751 .23199 .20900 18829 .16963 15282 13768 .12403 12% .89286 .79719 .71178 .63552 .56743 50663 45235 40388 36061 32197 28748 25668 22917 20462 18270 16312 .14564 .13004 11611 10367 15% .86957 .75614 .65752 57175 49718 43233 37594 .32690 28426 .24719 21494 .18691 .16253 14133 .12289 .10687 .09293 .08081 .07027 .06110 TABLE 4 Present Value of an Annuity of 1 (n) Payments 4% 1 2 3 4 5 6 7 8 9 10 11. 12 13 14 15 16 17 18 19 20 .96154 1.88609 2.77509 3.62990 4.45182 5.24214 6.00205 6.73274 7.43533 8.11090 5% 95238 94340 1.85941 1.83339 2.72325 2.67301 3.54595 3.46511 4.21236 4.32948 6% 7.72173 8.76048 9.38507 9.98565 10.56312 9.89864 11.11839 7% .93458 1.80802 2.62432 3.38721 5.07569 4.91732 4.76654 5.78637 5.58238 5.38929 6.46321 6.20979 5.97130 7.10782 6.80169 7.36009 11.65230 10.83777 10.10590 12.16567 11.27407 10.47726 12.65930 11.68959 10.82760 13.13394 12.08532 11.15812 13.59033 12.46221 11.46992 4.10020 8% 9% 91743 1.75911 2.57710 2.53130 3.31213 3.23972 3.99271 3.88965 4.62288 4.48592 5.20637 5.03295 5.74664 6.51523 6.24689 7.02358 6.71008 8.30641 7.88687 7.49867 7.13896 8.86325 8.38384 9.39357 8.85268 9.29498 10.37966 9.71225 9.10791 92593 1.78326 10.05909 10.33560 10.59401 9.44665 8.85137 9.76322 6.80519 7.94269 7.53608 7.16073 8.35765 7.90378 7.48690 7.10336 8.74547 8.24424 7.78615 7.36669 8.55948 8.06069 7.60608 9.12164 10% 9.37189 9.60360 9.81815 .90909 11% .90090 1.73554 1.71252 2.48685 2.44371 3.16986 3.10245 3.79079 3.69590 4.35526 4.86842 4.71220 5.14612 4.23054 5.53482 5.33493 5.99525 5.75902 5.53705 6.41766 6.14457 5.88923 6.49506 6.20652 6.81369 6.49236 6.74987 6.98187 7.19087 12% .89286 1.69005 2.40183 3.03735 3.60478 4.11141 4.56376 4.96764 5.32825 5.65022 15% 8.31256 7.82371 7.37916 6.97399 8.54363 8.02155 7.54879 7.11963 8.75563 8.20141 7.70162 7.24967 8.95012 8.36492 7.83929 7.36578 9.12855 8.51356 7.96333 7.46944 .86957 1.62571 2.28323 2.85498 3.35216 3.78448 4.16042 4.48732 4.77158 5.01877 5.93770 5.23371 6.19437 5.42062 6.42355 5.58315 6.62817 5.72448 6.81086 5.84737 5.95424 6.04716 6.12797 6.19823 6.25933 Wildhorse Clinic is considering investing in new heart-monitoring equipment. It has two options. Option A would have an initial lower cost but would require a significant expenditure for rebuilding after 4 years. Option B would require no rebuilding expenditure, but its maintenance costs would be higher. Since the Option B machine is of initial higher quality, it is expected to have a salvage value at the end of its useful life. The following estimates were made of the cash flows. The company's cost of capital is 5%. Initial cost Annual cash inflows Annual cash outflows Cost to rebuild (end of year 4) Salvage value Estimated useful life Click here to view PV table. (a) Your answer is partially correct. Option A Option B Option A $166,000 $70,600 $31,700 $49,600 $ $ 7 years Compute the (1) net present value. (2) profitability index, and (3) internal rate of return for each option. (Hint: To solve for internal rate of return, experiment with alternative discount rates to arrive at a net present value of zero.) (If the net present value is negative, use either a negative sign preceding the number eg -45 or parentheses eg (45). Round answers for present value and IRR to O decimal places, e.g. 125 and round profitability index to 2 decimal places, e.g. 12.50. For calculation purposes, use 5 decimal places as displayed in the factor table provided.) $0 Net Present Value Option B $278,000 $81,000 $26.700 $0 $8,800 7 years Profitability Index Internal Rate of Return % % TABLE 1 Future Value of 1 (n) Periods 4% 0 1 2 3 4 5 6 7 8 9 10. 11 12 13 14 15 16 17 18 19 20 5% 1.00000 1.05000 1.10250 1.12486 1.15763 1.16986 1.21551 1.21665 1.27628 1.00000 1.04000 1.08160 1.26532 1.31593 1.36857 1.42331 1.48024 1.53945 1.60103 1.66507 1.73168 1.80094 1.34010 1.40710 1.47746 1.55133 1.62889 6% 1.00000 1.06000 1.12360 1.19102 1.26248 1.31080 1.33823 1.40255 1.71034 1.79586 1.88565 1.97993 2.26090 2.07893 2.39656 7% 1.41852 1.50073 1.50363 1.60578 1.59385 1.71819 1.68948 1.83846 1.79085 1.96715 1.89830 2.10485 2.01220 2.25219 2.13293 2.40985 2.57853 2.75903 1.00000 1.07000 1.14490 1.22504 1.87298 2.18287 1.94790 2.29202 2.02582 2.40662 2.10685 2.52695 2.19112 2.65330 3.20714 3.02560 8% 1.00000 1.08000 1.16640 1.25971 1.36049 1.46933 9% 10% 1.00000 1.09000 1.10000 1.21000 1.33100 1.46410 1.61051 2.15892 1.00000 1.18810 1.29503 1.41158 1.53862 1.58687 1.67710 1.71382 1.82804 1.85093 1.99256 1.99900 2.17189 2.36736 2.54035 2.95216 3.42594 3.97031 2.69277 3.15882 3.70002 4.32763 2.85434 3.37993 3.99602 4.71712 3.61653 4.31570 5.14166 3.86968 4.66096 5.60441 1.77156 1.94872 2.14359 2.35795 2.59374 2.33164 2.58043 2.85312 2.51817 2.81267 3.13843 2.71962 3.06581 3.45227 3.79750 2.93719 3.34173 3.17217 3.64248 4.17725 11% 1.00000 1.11000 1.12000 1.23210 1.25440 1.36763 1.40493 1.51807 1.57352 1.76234 6.11591 1.68506 3.15176 12% 1.87041 1.97382 2.07616 2.21068 2.30454 2.47596 2.55803 2.77308 2.83942 3.10585 4.59497 5.31089 5.05447 5.89509 5.55992 6.54355 7.26334 6.72750 8.06231 1.00000 3.47855 3.89598 4.36349 4.88711 3.49845 3.88328 4.31044 4.78459 5.47357 15% 1.00000 1.15000 1.32250 1.52088 1.74901 2.01136 2.31306 2.66002 3.05902 3.51788 4.04556 4.65239 5.35025 6.15279 7.07571 8.13706 6.13039 9.35762 6.86604 10.76126 7.68997 12.37545 8.61276 14.23177 9.64629 16.36654 TABLE 2 Future Value of an Annuity of 1 (n) Payments 4% 1 2 3 4 5 6 7 8 9 10 11 12 13 14 15 16 17 18 19 20 1.00000 2.04000 3.12160 4.24646 5.41632 6.63298 5% 1.00000 7.89829 2.05000 3.15250 2.06000 3.18360 4.31013 4.37462 5.52563 5.63709 6% 1.00000 13.48635 14.20679 15.02581 15.91713 16.62684 17.71298 18.29191 19.59863 20.02359 21.57856 21.82453 23.65749 23.69751 25.84037 25.64541 28.13238 27.67123 30.53900 29.77808 33.06595 7.33592 8.92280 9.89747 10.2598 10.63663 9.21423 10.58280 11.02656 11.49132 11.9780 12.48756 12.00611 12.57789 13.18079 13.8164 14.48656 7% 6.80191 6.97532 7.1533 8.14201 8.39384 8.6540 9.54911 1.0000 2.0700 3.2149 4.4399 5.7507 18.88214 8% 9% 10% 1.00000 1.00000 1.00000 2.08000 2.09000 2.10000 3.24640 3.27810 4.50611 4.57313 5.86660 5.98471 14.97164 15.7836 16.64549 16.86994 17.8885 18.97713 21.49530 22.95339 24.21492 26.01919 20.1406 21.01507 22.5505 23.27597 25.1290 27.15211 11% 12% 15% 1.00000 1.00000 1.00000 2.11000 2.12000 2.15000 3.37440 3.47250 4.77933 4.99338 6.35285 6.74238 3.31000 3.34210 4.64100 4.70973 6.22780 6.10510 7.52334 7.71561 7.91286 9.20044 9.48717 9.78327 10.08901 11.43589 11.85943 12.29969 13.72682 11.02847 13.02104 13.57948 14.16397 14.77566 16.78584 15.19293 15.93743 16.72201 17.54874 20.30372 8.11519 8.75374 11.06680 24.34928 17.56029 18.53117 19.56143 20.65458 20.14072 21.38428 22.71319 24.13313 24.52271 26.21164 28.02911 29.00167 34.35192 27.97498 30.09492 32.39260 40.50471 29.36092 31.77248 34.40536 37.27972 47.58041 25.67253 27.8881 30.32428 33.00340 35.94973 39.18995 42.75328 28.21288 30.8402 33.75023 36.97351 40.54470 44.50084 48.88367 30.90565 33.9990 37.45024 41.30134 45.59917 50.39593 55.74972 37.3790 41.44626 46.01846 51.15909 56.93949 63.43968 40.9955 45.76196 51.16012 33.75999 36.78559 55.71747 65.07509 75.83636 88.21181 57.27500 64.20283 72.05244 102.44358 TABLE 3 Present Value of 1 (n) Periods 4% 1 2 3 4 5 6 7 8 9 10 11 12 13 14 15 16 17 18 19 20 .96154 .92456 .88900 .85480 .82193 .79031 .75992 .73069 .70259 .67556 .64958 .62460 .60057 57748 .55526 .53391 51337 .49363 47464 45639 5% .95238 .90703 .86384 82270 .78353 .74622 .71068 .67684 .64461 .61391 58468 55684 53032 50507 48102 45811 43630 .41552 .39573 .37689 6% .94340 .89000 .83962 .79209 .74726 70496 .66506 .62741 59190 55839 52679 49697 46884 44230 41727 39365 .37136 35034 33051 31180 7% 93458 .87344 .81630 .76290 .71299 .66634 .62275 .58201 .54393 50835 .47509 .44401 41496 38782 .36245 .33873 .31657 29586 27615 25842 8% .92593 .85734 .79383 73503 .68058 .63017 58349 .54027 50025 .46319 42888 .39711 .36770 .34046 .31524 29189 27027 25025 23171 21455 9% .91743 84168 77218 .70843 .64993 .59627 .54703 .50187 46043 .42241 .38753 .35554 .32618 .29925 .27454 25187 .23107 21199 19449 .17843 10% .90909 .82645 75132 .68301 .62092 56447 51316 46651 .42410 .38554 .35049 .31863 .28966 26333 .23939 21763 .19785 .17986 .16351 .14864 11% .90090 .81162 73119 .65873 .59345 53464 48166 43393 39092 35218 .31728 28584 25751 .23199 .20900 18829 .16963 15282 13768 .12403 12% .89286 .79719 .71178 .63552 .56743 50663 45235 40388 36061 32197 28748 25668 22917 20462 18270 16312 .14564 .13004 11611 10367 15% .86957 .75614 .65752 57175 49718 43233 37594 .32690 28426 .24719 21494 .18691 .16253 14133 .12289 .10687 .09293 .08081 .07027 .06110 TABLE 4 Present Value of an Annuity of 1 (n) Payments 4% 1 2 3 4 5 6 7 8 9 10 11. 12 13 14 15 16 17 18 19 20 .96154 1.88609 2.77509 3.62990 4.45182 5.24214 6.00205 6.73274 7.43533 8.11090 5% 95238 94340 1.85941 1.83339 2.72325 2.67301 3.54595 3.46511 4.21236 4.32948 6% 7.72173 8.76048 9.38507 9.98565 10.56312 9.89864 11.11839 7% .93458 1.80802 2.62432 3.38721 5.07569 4.91732 4.76654 5.78637 5.58238 5.38929 6.46321 6.20979 5.97130 7.10782 6.80169 7.36009 11.65230 10.83777 10.10590 12.16567 11.27407 10.47726 12.65930 11.68959 10.82760 13.13394 12.08532 11.15812 13.59033 12.46221 11.46992 4.10020 8% 9% 91743 1.75911 2.57710 2.53130 3.31213 3.23972 3.99271 3.88965 4.62288 4.48592 5.20637 5.03295 5.74664 6.51523 6.24689 7.02358 6.71008 8.30641 7.88687 7.49867 7.13896 8.86325 8.38384 9.39357 8.85268 9.29498 10.37966 9.71225 9.10791 92593 1.78326 10.05909 10.33560 10.59401 9.44665 8.85137 9.76322 6.80519 7.94269 7.53608 7.16073 8.35765 7.90378 7.48690 7.10336 8.74547 8.24424 7.78615 7.36669 8.55948 8.06069 7.60608 9.12164 10% 9.37189 9.60360 9.81815 .90909 11% .90090 1.73554 1.71252 2.48685 2.44371 3.16986 3.10245 3.79079 3.69590 4.35526 4.86842 4.71220 5.14612 4.23054 5.53482 5.33493 5.99525 5.75902 5.53705 6.41766 6.14457 5.88923 6.49506 6.20652 6.81369 6.49236 6.74987 6.98187 7.19087 12% .89286 1.69005 2.40183 3.03735 3.60478 4.11141 4.56376 4.96764 5.32825 5.65022 15% 8.31256 7.82371 7.37916 6.97399 8.54363 8.02155 7.54879 7.11963 8.75563 8.20141 7.70162 7.24967 8.95012 8.36492 7.83929 7.36578 9.12855 8.51356 7.96333 7.46944 .86957 1.62571 2.28323 2.85498 3.35216 3.78448 4.16042 4.48732 4.77158 5.01877 5.93770 5.23371 6.19437 5.42062 6.42355 5.58315 6.62817 5.72448 6.81086 5.84737 5.95424 6.04716 6.12797 6.19823 6.25933
Expert Answer:
Answer rating: 100% (QA)
Option A Option B Explanation Year 1 4 2 3 4 5 Internal Rate of Return 8 9 Annual cash flow 38900 38... View the full answer

Related Book For 

Managerial Accounting Tools for Business Decision Making
ISBN: 978-1118856994
4th Canadian edition
Authors: Jerry J. Weygandt, Paul D. Kimmel, Donald E. Kieso, Ibrahim M. Aly
Posted Date:
Students also viewed these accounting questions
-
Goltra Clinic is considering investing in new heart monitoring equipment. It has two options: Option A would have an initial lower cost but would require a significant expenditure for rebuilding...
-
Berens River Clinic is considering investing in new heart monitoring equipment. It has two options: Option A would have an initial lower cost but would require a significant expenditure for...
-
Carolina Clinic is considering investing in new heart monitoring equipment. It has two options: Option A would have an initial lower cost but would require a significant expenditure for rebuilding...
-
A 32- resistor and a 20- resistor are connected in parallel, and the combination is connected across a 240-V dc line. (a) What is the resistance of the parallel combination? (b) What is the total...
-
David Shannon believes that the allocation of inventoriable costs should be based on the actual physical flow of the goods. Explain to David why this may be both impractical and inappropriate.
-
2.3 Sinbad Bhid's constitution has a provision for 80 million ordinary shares, and its paid-up share capital comprised 60 million shares paid-up to RM72 million. To raise funds Sinbad Bhd made a...
-
After how many time constants has the voltage across a discharging capacitor decayed to \(0.10 \%\) of its initial value?
-
Prescott Corp. manufactures computer desks in its Seville, Ohio, plant. The company uses activity- based costing to allocate all manufacturing conversion costs (direct labor and manufacturing...
-
Under a reporting form policy, what information must be reported monthly? Under a reporting form policy, what information must be reported monthly?
-
Chaplin Arts, Inc.s comparative balance sheets for December 31, 2014 and 2013 follow. The following additional information about Chaplin Artss operations during 2013 is available: (a) Net income,...
-
A company reported the following data for the year ending 2018: Description Amount Sales Sales discount Sales returns and allowances Cost of goods sold Operating expense Income tax expense $400,000...
-
income statement for the month of June, what would be his contribution margin?
-
toyota AI software project plan that define the folowinng projects objectives organization objectives project scope project assumption project roles and responsibilities risk managment with populated...
-
Describe a company (that you are familiar with or that you research on the internet). Prepare a SWOT Analysis and then identify, based on your SWOT, a new organizational strategy. Focus on one...
-
1) What is bias-free language? Answer the question and provide an example. 2) What is paraphrasing? 3) How might send tactless messages affect someone's career? 4) What are 2 things you should do...
-
What should you, the writer, consider when selecting a topic for professional or technical writing?
-
Find the unit vector with the same direction as the vector (1,−3). A. (110‾‾‾√,−310‾‾‾√) B. (14,−34) C. (110,−310) D....
-
What is the ideal number of children to have? This question was asked on the Sullivan Statistics Survey I. Draw a dot plot of the variable Children from theSullivanStatsSurveyI data set at...
-
Crede Manufacturing Company uses a standard cost accounting system. In 2016, 28,000 units were produced. Each unit took several kilograms of direct materials and 1.6 standard hours of direct labour...
-
Bahrat, Inc. produces three separate products from a common process costing $100,000. Each of the products can be sold at the split-off point or can be processed further and then sold for a higher...
-
Roche and Young, CAs, are preparing their service revenue (sales) budget for 2016. Their practice is divided into three departments: auditing, tax, and consulting. Billable hours for each department,...
-
Compute the price of a share of stock that pays a \($5\) per year dividend and that you expect to be able to sell in one year for \($40\), assuming you require a 5% return.
-
You are considering purchasing a 10-year bond and follow the theory of rational expectations. If you have just read the annual report of the central bank in your country that states interest rates...
-
Suppose that you are a trader at the stock market. T-Mobiles stocks currently trade at $45 and the expected return is 9%. You have information that leads you to believe that by the end of year the...

Study smarter with the SolutionInn App