

Question: Will give Like for fast answer! Consider the following table: Scenario Severe recession Mild recession Normal growth Boom Probability 0.10 0.20 0.35 0.35 Stock Fund
Will give Like for fast answer!
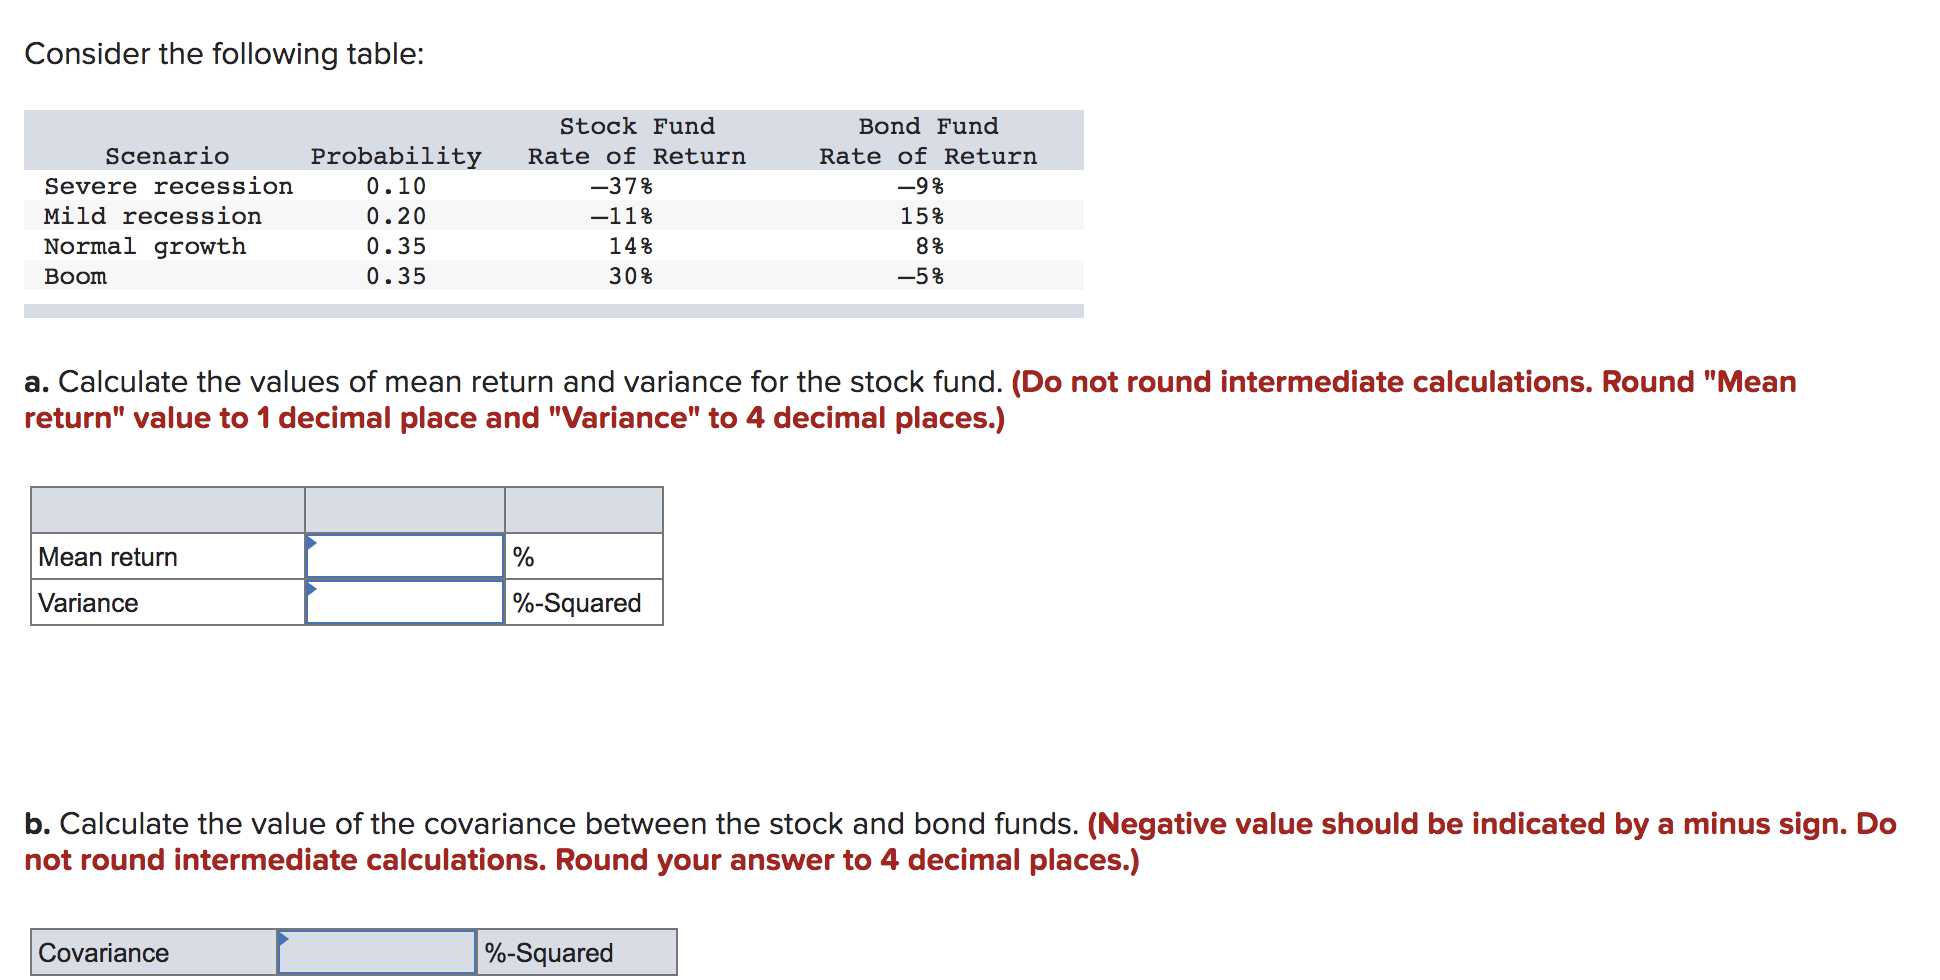
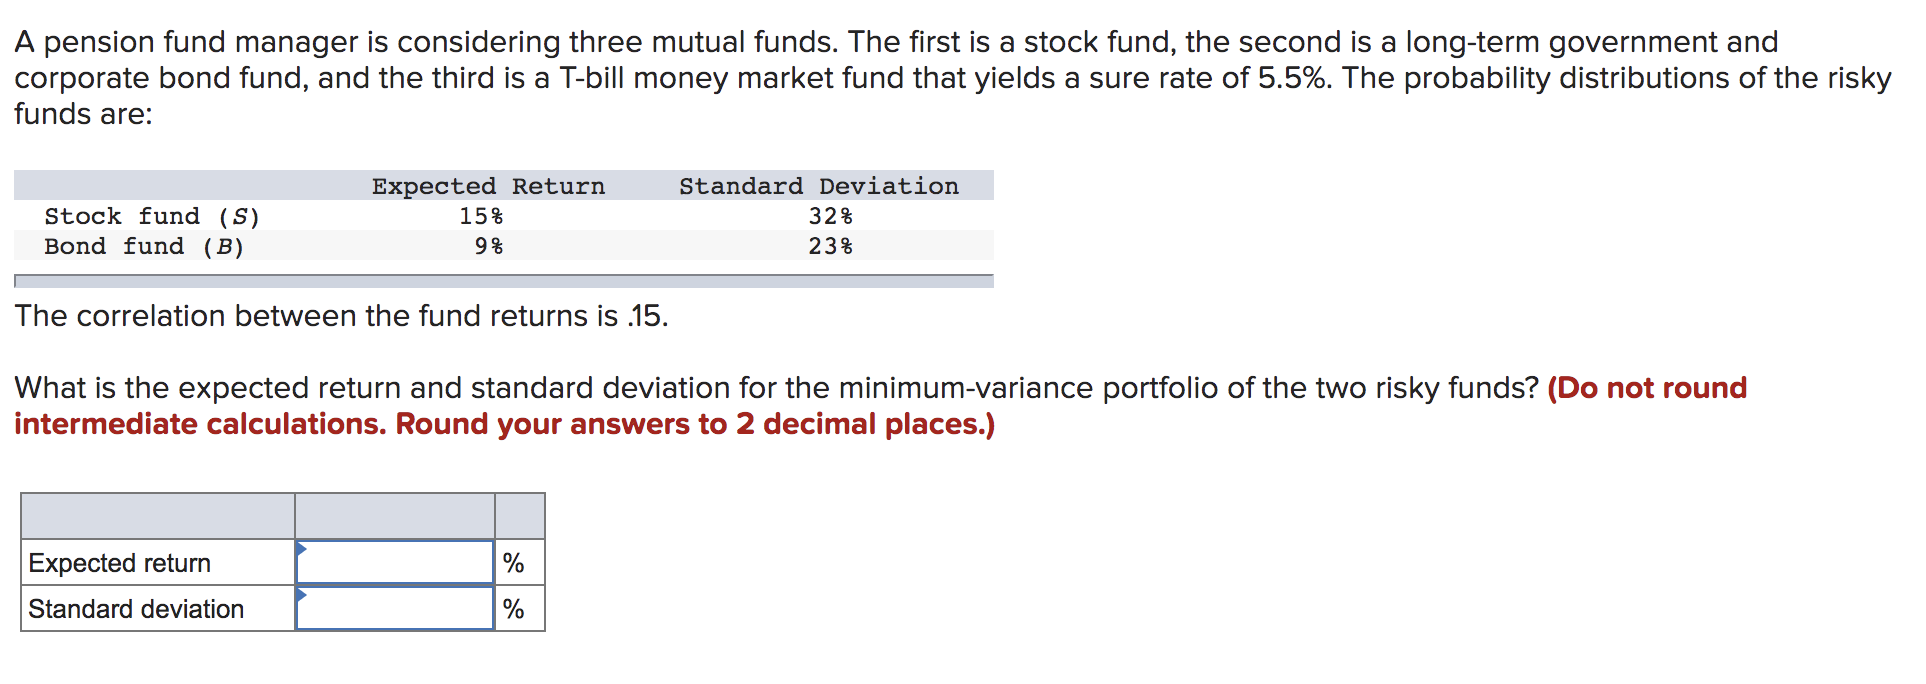
Consider the following table: Scenario Severe recession Mild recession Normal growth Boom Probability 0.10 0.20 0.35 0.35 Stock Fund Rate of Return -37% -11% 14% 30% Bond Fund Rate of Return -9% 15% 8% -5% a. Calculate the values of mean return and variance for the stock fund. (Do not round intermediate calculations. Round "Mean return" value to 1 decimal place and "Variance" to 4 decimal places.) Mean return % Variance %-Squared b. Calculate the value of the covariance between the stock and bond funds. (Negative value should be indicated by a minus sign. Do not round intermediate calculations. Round your answer to 4 decimal places.) Covariance %-Squared A pension fund manager is considering three mutual funds. The first is a stock fund, the second is a long-term government and corporate bond fund, and the third is a T-bill money market fund that yields a sure rate of 5.5%. The probability distributions of the risky funds are: Stock fund (S) Bond fund (B) Expected Return 15% 9% Standard deviation 32% 23% The correlation between the fund returns is .15. What is the expected return and standard deviation for the minimum-variance portfolio of the two risky funds? (Do not round intermediate calculations. Round your answers to 2 decimal places.) Expected return % Standard deviation %
Step by Step Solution
There are 3 Steps involved in it

Get step-by-step solutions from verified subject matter experts