

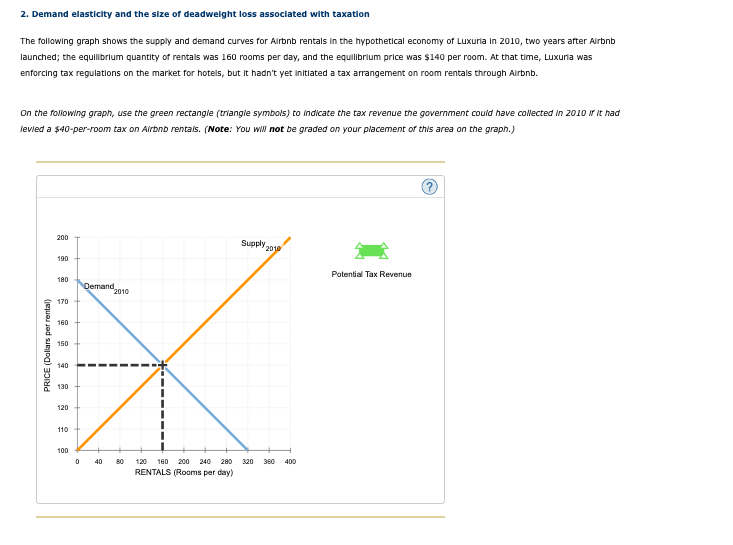
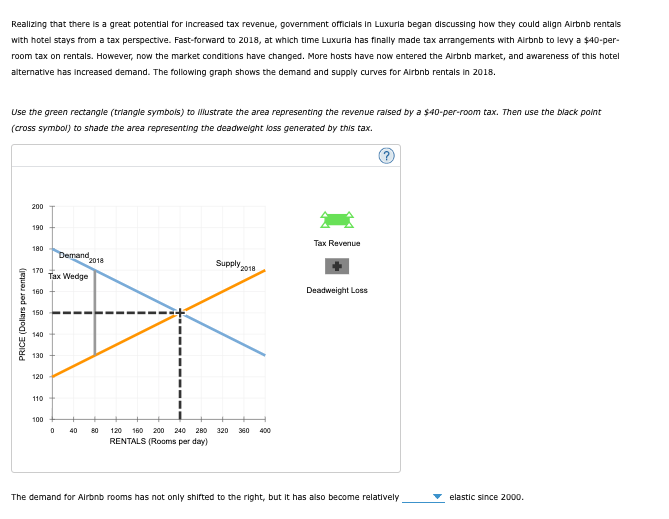
Question: Will rate asap if correct ! Please help 2. Demand elasticity and the size of deadweight loss associated with taxation The following graph shows the
 Will rate asap if correct ! Please help
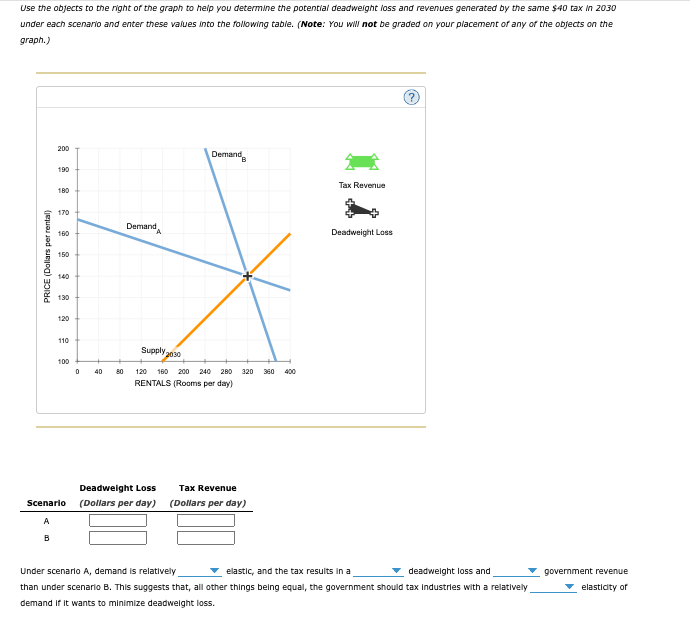
2. Demand elasticity and the size of deadweight loss associated with taxation The following graph shows the supply and demand curves for Airbnb rentals in the hypothetical economy of Luxuria in 2010, two years after Aurbnb launched; the equllibrium quantity of rentals was 160 rooms per day, and the equllibrium price was $140 per room. At that time, Luxurla was enforcing tax regulations on the market for hotels, but it hadn't yet initlated a tax arrangement on room rentals through Airbnb. On the following graph, use the green rectangle (triangle symbols) to indicate the tax revenue the government could have collected in 2010 if it had Jevied a \$40-per-room tax on Airtnb rentais. (Note: You wil not be graded on your placement of this area on the graph.) Realizing that there is a great potential for increased tax revenue, government officials in Luxuria began discussing how they could align Alrbnb rentals with hotel stays from a tax perspectlve. Fast-forward to 2018 , at which time Luxuria has finally made tax arrangements with Airbnb to levy a $40-perroom tax on rentals. However, now the market conditions have changed. More hosts have now entered the Airbnb market, and awareness of this hotel alternative has increased demand. The following graph shows the demand and supply curves for Arbnb rentals in 2018. Use the green rectangle (triangle symbois) to Wustrate the area representing the revenue raised by a $40-per-room tax. Then use the black point (cross symbol) to shade the area representing the deadweight loss generated by this tax. The demand for Alrbnb rooms has not only shifted to the right, but it has also become relatively elastic since 2000. Use the objects to the right of the graph to haip you determine the potential deadweight loss and revenues generated by the same $40 tax in 2030 under each scenario and enter these vaiues into the following table. (Note: You wW not be graded on your placement of any of the objects on the graph.) Under scenario A, demand is relatively elastic, and the tax results in a deadweight loss and government revenue than under scenario B. This suggests that, all other things being equal, the government should tax industries with a relatively elastioity of demand if it wants to minimize deadweight loss
Step by Step Solution
There are 3 Steps involved in it

Get step-by-step solutions from verified subject matter experts